LCA er en forkortelse som står for Life Cycle Assessment. På norsk oversettes uttrykket ofte til livssyklusanalyse, eller livsløpsanalyse.
Forskergrupper i NIBIO bruker livsløpsanalyser for å vurdere miljøeffekter av å produsere, distribuere, bruke og avfallshåndtere varer og tjenester med basis i biologiske ressurser.
Livsløpsanalyser er en systematisk gjennomgang av alle trinn fra utvinning av råstoffene som trengs for et produkt eller en tjeneste, til det blir resirkulert eller kastet som avfall. Dette omtales gjerne som at en følger produktet fra vogge til grav. Metoden er internasjonalt standardisert (ISO 14040/14044), og kan besvare tre sentrale spørsmål:
Hvilke viktige miljøproblemer skapes av et system?
Hvor i livsløpet oppstår disse miljøproblemene?
Hvor ligger det største potensialet for miljømessig forbedring av et system?
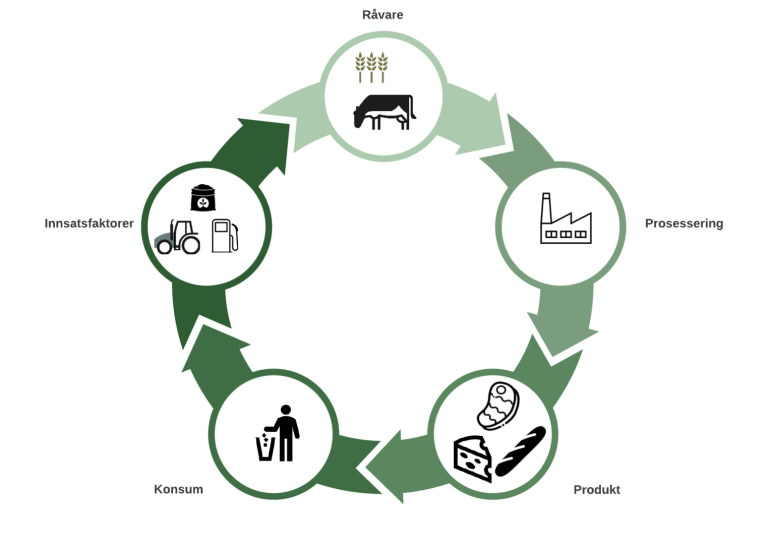
Det er omfattende og ikke alltid relevant å beregne hele livsløpet til et produkt eller en tjeneste fra utvinning av råstoff til avhending. En LCA kan også begrenses til å gjelde deler av livsløpet, for eksempel fra vogge til gårdsgrinda, til butikkhylla eller hjem til forbruker. Dette gjøres ved å definere en systemgrense for hva som skal inkluderes i beregningene.
I tillegg til å avgjøre hvilke deler av en verdikjede som inkluderes, må en også bestemme hvilke prosesser som skal tas med innenfor det definerte systemet. Skal en f.eks. ta hensyn til utslipp knyttet til nedbryting eller binding av organisk materiale i jorda, til produksjonen av bygninger, etc.? Definisjonen av systemgrensen og hvilke prosesser som skal inkluderes innenfor systemet er avgjørende for resultatet av en LCA.
Før en kan gjennomføre en analyse må en også definere en såkalt funksjonell enhet. Den funksjonelle enheten er et kvantitativt mål på produktet eller tjenesten som skal leveres. En funksjonell enhet kan f.eks. være ett kilo brød (ferskvekt) levert fram til butikkhylla, eller 15 000 km årlig persontransport på veg. Systemgrensene må nødvendigvis korrespondere med den funksjonelle enheten.
I analysen summeres alle utslipp som oppstår helt fra utvinning av råstoff og for alle trinn i verdikjeden fram til funksjonell enhet, og for alle prosesser som er inkludert. For enkelthets skyld grupperes utslippene i kategorier, der alle utslipp innenfor én kategori regnes om til en felles enhet. For eksempel, utslipp av klimagasser som karbondioksid (CO2), metan og lystgass omregnes til kilogram CO2-ekvivalenter (kg CO2e). Hvordan metan og lystgass veies mot CO2, varierer med hvilken tidsperiode man ser på, men typisk brukes en 100-års periode. Resultatene presenteres dermed ofte som GWP100, som viser klimagassenes potensielle oppvarmingseffekt over 100 år.
Kategoriene i en LCA kalles gjerne miljøindikatorer, og antall miljøindikatorer og hva den enkelte inkluderer/beskriver kan variere i forhold til målsetningen med analysen og mellom mulighetene i ulike programmer som brukes til å kjøre en LCA. Miljøbelastningen til et produkt eller en tjeneste uttrykkes normalt som forholdet mellom hver av miljøindikatorene og den funksjonelle enheten. Et eksempel på et slikt forhold kan være den globale oppvarmingseffekt knyttet til produksjonen av 1 kg brød levert til butikkhylla, med enhet kg CO2e/kg brød.
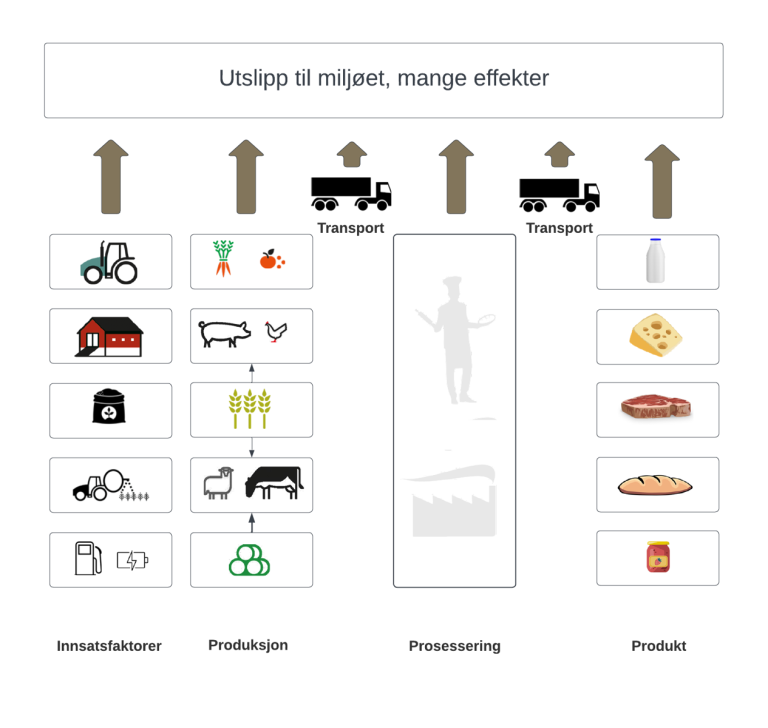
LCA dekker ikke alle typer miljøpåvirkning og innebærer flere forenklinger og usikkerhetsfaktorer, spesielt når den brukes på biologiske prosesser som er vanskelige å overvåke eller måle og har en stor naturlig variasjon.
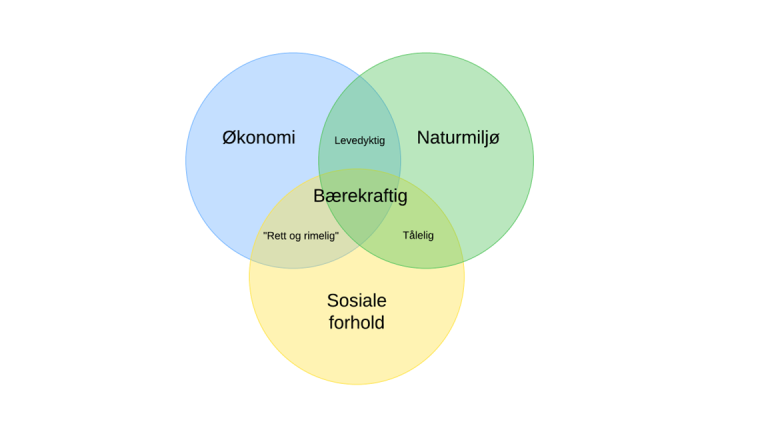
Et produkt kan ikke være bærekraftig i seg selv, men produksjonen av produktet kan være det. En klassisk LCA omfatter påvirkning på naturmiljøet, men det er også mulig å lage sosial LCA og økonomisk LCA. I tillegg jobbes det med å inkludere biologisk mangfold og bærekraft. Hittil mangler slike faktorer for at LCA skal gi en mer helthetlig analyse.
Tolking av resultater
Ved tolking av resultater av LCA er det viktig å være bevisst på systemgrensene, da disse som nevnt påvirker resultatet av analysen. Forskjeller mellom studier i definisjon av systemgrensene gjør det svært utfordrende, og ikke anbefalt å sammenligne LCA resultater fra ulike studier med mindre de har brukt eksakt samme systemgrenser.
NIBIO har valgt å etablere LCA-metoden i instituttets verktøykasse fordi den gir mulighet til å summere opp flere typer påvirkninger i et internasjonalt standardisert og anerkjent indikatorsett, fordi den gir mulighet til å benytte seg av store databaser som en kan bygge nye analyser på, og fordi både næring og forvaltning etterspør analyser der den brukes. Under finnes en liste med publikasjoner innen fagfeltet, samt oversikt over en del prosjekter hvor metodikken er brukt.
The materials used in construction have a significant environmental impact and this is becoming more important as operational energy requirements continue to fall. It is therefore becoming increasingly important to take into account the environmental burdens associated with materials used in construction. Life cycle assessment (LCA) and Environmental Product Declarations (EPD) are useful tools for this purpose. When comparing the results of numerous LCA studies of different construction materials, the main question is often ‘Which material is better for the environment?’. The answer, however, is usually not as simple – but why is it so difficult to decide which material has the lowest environmental impact? To answer this question, we have to consider what life cycle assessment is and how an LCA is undertaken. The report covers the stages of an LCA, from defining the goal and scope of the respective study to the creation of the life cycle inventory (LCI), the life cycle impact assessment (LCIA) to the reporting and interpretation of the results. Additionally, the report goes in detail into how to approach published LCA studies, how to work with EPDs and the much-discussed issue of Carbon storage in buildings. In the final chapter, the report assesses the comparability of published studies evaluating the environmental impact of different building materials.
The availability of fresh vegetables grown in greenhouses under controlled conditions throughout the year has given rise to concerns about their impact on the environment. In high latitude countries such as Norway, greenhouse vegetable production requires large amounts of energy for heat and light, especially during the winter. The use of renewable energy such as hydroelectricity and its effect on the environment has not been well documented. Neither has the effect of different production strategies on the environment been studied to a large extent. We conducted a life cycle assessment (LCA) of greenhouse tomato production for mid-March to mid-October (seasonal production), 20th January to 20th November (extended seasonal) production, and year-round production including the processes from raw material extraction to farm gate. Three production seasons and six greenhouse designs were included, at one location in southwestern and one in northern Norway. The SimaPro software was used to calculate the environmental impact. Across the three production seasons, the lowest global warming (GW) potential (600 g CO2-eq per 1 kg tomatoes) was observed during year-round production in southwestern Norway for the design NDSFMLLED + LED, while the highest GW potential (3100 g CO2-eq per 1 kg tomatoes) was observed during seasonal production in northern Norway for the design NS. The choice of artificial lighting (HPS (High Pressure Sodium) or LED (Light Emitting Diodes)), heating system and the production season was found to have had a considerable effect on the environmental impact. Moreover, there was a significant reduction in most of the impact categories including GW potential, terrestrial acidification, and fossil resource scarcity from seasonal to year-round production. Overall, year-round production in southwestern Norway had the lowest environmental impact of the evaluated production types. Heating of the greenhouse using natural gas and electricity was the biggest contributor to most of the impact categories. The use of an electric heat pump and LED lights during extended seasonal and year-round production both decreased the environmental impact. However, while replacing natural gas with electricity resulted in decreased GW potential, it increased the ecotoxicity potential.
Young children have unique nutritional requirements, and breastfeeding is the best option to support healthy growth and development. Concerns have been raised around the increasing use of milk-based infant formulas in replacement of breastfeeding, in regards to health, social, economic and environmental factors. However, literature on the environmental impact of infant formula feeding and breastfeeding is scarce. In this study we estimated the environmental impact of four months exclusive feeding with infant formula compared to four months exclusive breastfeeding in a Norwegian setting. We used life-cycle assessment (LCA) methodology, including the impact categories global warming potential, terrestrial acidification, marine and freshwater eutrophication, and land use. We found that the environmental impact of four months exclusive feeding with infant formula was 35–72% higher than that of four months exclusive breastfeeding, depending on the impact category. For infant formula, cow milk was the main contributor to total score for all impact categories. The environmental impact of breastfeeding was dependant on the composition of the lactating mother’s diet. In conclusion, we found that breastfeeding has a lower environmental impact than feeding with infant formula. A limitation of the study is the use of secondary LCA data for raw ingredients and processes.
As the demand for proteins increases with growing populations, farmed seaweed is a potential option for use directly as an ingredient for food, feed, or other applications, as it does not require agricultural areas. In this study, a life cycle assessment was utilised to calculate the environmental performance and evaluate possible improvements of the entire value chain from production of sugar kelp seedings to extracted protein. The impacts of both technical- and biological factors on the environmental outcomes were examined, and sensitivity and uncertainty analyses were conducted to analyse the impact of the uncertainty of the input variables on the variance of the environmental impact results of seaweed protein production. The current production of seaweed protein was found to have a global warming potential (GWP) that is four times higher than that of soy protein from Brazil. Further, of the 23 scenarios modelled, two resulted in lower GWPs and energy consumption per kg of seaweed protein relative to soy protein. These results present possibilities for improving the environmental impact of seaweed protein production. The most important variables for producing seaweed protein with low environmental impact are the source of drying energy for seaweed, followed by a high protein content in the dry matter, and a high dry matter in the harvested seaweed. In the two best scenarios modelled in this study, the dry matter content was 20% and the protein content 19.2% and 24.3% in dry matter. This resulted in a lower environmental impact for seaweed protein production than that of soy protein from Brazil. These scenarios should be the basis for a more environmental protein production in the future.
The aim of this work was to calculate farm specific LCAs for milk-production on 200 dairy farms in Central Norway, where 185 farmed conventional and 15 according to organic standards. We assume that there are variations in environmental emission drivers between farms and therefore also variation in indicators. We think that information can be utilized to find management improvements on individual farms. Farm specific data on inputs and production for the calendar years 2014 to 2016 were used. The LCAs were calculated for purchased products and on farm-emissions, including atmospheric deposition, biological nitrogen fixation, use of fertilizer and manure. The enteric methane emission from digestion was calculated for different animal groups. The functional unit was one kg energy- corrected milk (ECM) delivered at farm-gate. For the 200 dairy farms there were huge variations of farm characteristics, environmental per- formance and economic outcome. On average, the organic farms produced milk with a lower carbon footprint (1.2 kg CO2 eq./kg ECM) than the conventional ones (1.4 kg CO2 eq./kg ECM). The organic farms had also a lower energy intensity (3.1 MJ/kg ECM) and nitrogen intensity (5.0 kg N/kg N) than their conventional colleagues (4.1 MJ/kg ECM and 6.9 kg N/kg N respectively). The contribution margin was better on the organic farms with 6.6 NOK/kg ECM compared to the conventional with 5.9 NOK/kg ECM. The average levels of the environmental indicators were comparable but slightly higher than findings in other international studies. The current study proved that the FARMnor model allows to calculate LCAs for large number of individual farms. The results show that the environmental performance and economic outcome vary between farms. We recommend that farm specific LCA-results are used to unveil what needs to be changed for improving a farm’s environmental performance.
Jon HalfdanarsonMatthias KoeslingNina Pereira KvadsheimJan EmblemsvågCeline Rebours
Sammendrag
The continuous increase in global population and living standards, is leading to an increase in demand for food and feed resources. The world’s oceans have the largest unlocked potential for meeting such demands. Norway already has an extensive aquaculture industry, but still has great ambitions and possibilities to develop and expand this industry. One of the important topics for improving the value chain of Norwegian aquaculture is to secure the access to feed resources and to improve the environmental impacts. Today, most of the feed-protein sources used in aquaculture are imported in the form of soy protein. The research project Energy efficient PROcessing of MACroalgae in blue-green value chains (PROMAC) aimed, among other research questions, to investigate cultivated seaweeds as a potential raw material for fish feed. This paper assesses Life Cycle Analysis (LCA)-perspectives of scenarios for future seaweed production of feed-protein for fish and compares this with today’s situation of imported soy protein for fish feed. The insights from the LCA are very important for the configuration of the entire production value chain, to ensure that the environmental aspects are taken into account in a holistic fashion.
I dette studiet har vi ved hjelp av livsløpsanalyse (LCA) analysert miljøeffektane av å produsere norsk svinekjøtt. Utgangspunktet for analysa har vore eit fiktivt gardsbruk, plassert i Stange kommune, med kombinert svineproduksjon (både smågris-og slaktegrisproduksjon) og med kornproduksjon (bygg, vårkveite og havre) der gjødsla frå svinebesetninga blir utnytta. Som utgangspunkt analyserte vi eit tradisjonelt opplegg der grisane fekk kraftfôrblandingar tilpassa behovet som einaste fôr. Soya utgjorde 8% kraftfôrblandinga på råvektbasis. Vi analyserte svineproduksjonen under to ulike alternativ: a) At dei norske kornråvarene i kraftfôret var produsert på garden eller på ein tilsvarande gard, b) At dei norske kornråvarene i kraftfôret kom frå husdyrfrie gardar med mineralgjødsel som einaste gjødselslag. I tillegg analyserte vi på tilsvarande måte svineproduksjonen på garden i ein situajson der arealgrunnlaget blei utvida til også å omfatte eng, og der engavlinga blei brukt i ein bioraffineringsprosess til å produsere grassaft som proteinfôr til slaktegrisane i besetninga. Pressresten (pulp) blei selt som grovfôr til lokale storfeprodusentar. I tillegg til grassaft fekk slaktegrisane kraftfôr med redusert innhald av soya (6%) samanlikna med standardblandinga. Samla ga denne fôrrasjonen dekning av slaktegrisane sitt næringsbehov, slik at tilvekst og produksjonsresultat var det same i begge produksjonsopplegga.....
Callum Aidan Stephen HillAndrew NortonJanka Dibdiakova
Sammendrag
More than sixty environmental product declarations of insulation materials (glass wool, mineral wool, expanded polystyrene, extruded polystyrene, polyurethane, foam glass and cellulose) have been examined and the published information for global warming potential (GWP) and for embodied energy (EE) has been analysed and is presented. A peer-review literature survey of the data for GWP and EE associated with the different insulation products is also included. The data for GWP (kg carbon dioxide equivalents) and EE (megajoules) is reported in terms of product mass or as a functional unit (FU) (1 m2 of insulation with R = 1 m2 K/W). Data for some classes of insulation material (such as glass wool) exhibit a relatively narrow range of values when reported in terms of weight of product or as a functional unit. Other classes of insulation material exhibit much wider distributions of values (e.g., expanded polystyrene). When reported per weight of product, the hydrocarbon-based insulation materials exhibit higher GWP and EE values compared to inorganic or cellulosic equivalents. However, when compared on an FU basis this distinction is no longer apparent and some of the cellulosic based materials (obtained by refining of wood chips) show some of the highest EE values. The relationship between the EE and GWP per kg of insulation product has also been determined as being 15.8 MJ per kg CO2 equivalents.
Reduced N-surpluses in dairy farming is a strategy to reduce the environmental pollution from this production. This study was designed to analyse the important variables influencing nitrogen (N) surplus per hectare and per unit of N in produce for dairy farms and dairy systems across 10 certified organic and 10 conventional commercial dairy farms in Møre og Romsdal County, Norway, between 2010 and 2012. The N-surplus per hectare was calculated as N-input (net N-purchase and inputs from biological N-fixation, atmospheric deposition and free rangeland) minus N in produce (sold milk and meat gain), and the N-surplus per unit of N-produce as net Ninput divided by N in produce. On average, the organic farms produced milk and meat with lower N-surplus per hectare (88 ± 25 kg N·ha−1) than did conventional farms (220 ± 56 kg N·ha−1). Also, the N-surplus per unit of N-produce was on average lower on organic than on conventional farms, 4.2 ± 1.2 kg N·kg N−1 and 6.3 ± 0.9 kg N·kg N−1, respectively. All farms included both fully-cultivated land and native grassland. Nsurplus was found to be higher on the fully cultivated land than on native grassland. N-fertilizers (43%) and concentrates (30%) accounted for most of the N input on conventional farms. On organic farms, biological Nfixation and concentrates contributed to 32% and 36% of the N-input (43 ± 18 N·kg N−1 and 48 ± 11 N·kg N−1), respectively. An increase in N-input per hectare increased the amount of N-produce in milk and meat per hectare, but, on average for all farms, only 11% of the N-input was utilised as N-output; however, the N-surplus per unit of N in produce (delivered milk and meat gain) was not correlated to total N-input. This surplus was calculated for the dairy system, which also included the N-surplus on the off-farm area. Only 16% and 18% of this surplus on conventional and organic farms, respectively, was attributed to surplus derived from off-farm production of purchased feed and animals. Since the dairy farm area of conventional and organic farms comprised 52% and 60% of the dairy system area, respectively, it is crucial to relate production not only to dairy farm area but also to the dairy system area. On conventional dairy farms, the N-surplus per unit of N in produce decreased with increasing milk yield per cow. Organic farms tended to have lower N-surpluses than conventional farms with no correlation between the milk yield and the N-surplus. For both dairy farm and dairy system area, N-surpluses increased with increasing use of fertilizer N per hectare, biological N-fixation, imported concentrates and roughages and decreased with higher production per area. This highlights the importance of good agronomy that well utilize available nitrogen.
Ola Stedje HanserudKari-Anne LyngJerke W. de VriesAnne Falk ØgaardHelge Brattebø
Sammendrag
Specialized agricultural production between regions has led to large regional differences in soil phosphorus (P) over time. Redistribution of surplus manure P from high livestock density regions to regions with arable farming can improve agricultural P use efficiency. In this paper, the central research question was whether more efficient P use through manure P redistribution comes at a price of increased environmental impacts when compared to a reference system. Secondly, we wanted to explore the influence on impacts of regions with different characteristics. For this purpose, a life cycle assessment was performed and two regions in Norway were used as a case study. Several technology options for redistribution were examined in a set of scenarios, including solid–liquid separation, with and without anaerobic digestion of manure before separation. The most promising scenario in terms of environmental impacts was anaerobic digestion with subsequent decanter centrifuge separation of the digestate. This scenario showed that redistribution can be done with net environmental impacts being similar to or lower than the reference situation, including transport. The findings emphasize the need to use explicit regional characteristics of the donor and recipient regions to study the impacts of geographical redistribution of surplus P in organic fertilizer residues.
The aim of the study was to explore whether and how intensification would contribute to more environmentally friendly dairy production in Norway. Three typical farms were envisaged, representing intensive production strategies with regard to milk yield both per cow and per hectare in the three most important regions for dairy production in Norway. The scores on six impact categories for produced milk and meat were compared with corresponding scores obtained with a medium production intensity at a base case farm. Further, six scenario farms were derived from the base case. They were either intensified or made more extensive with regard to management practices that were likely to be varied and implemented under northern temperate conditions. The practices covered the proportion and composition of concentrates in animal diets and the production and feeding of forages with different energy concentration. Processes from cradle to farm gate were incorporated in the assessments, including on-farm activities, capital goods, machinery and production inputs. Compared to milk produced in a base case with an annual yield of 7250 kg energy corrected milk (ECM) per cow, milk from farms with yields of 9000 kg ECM or higher, scored better in terms of global warming potential (GWP). The milk from intensive farms scored more favourably also for terrestrial acidification (TA), fossil depletion (FD) and freshwater eutrophication (FE). However, this was not in all cases directly related to animal yield, but rather to lower burden from forage production. Production of high yields of energy-rich forage contributed substantially to the better scores on farms with higher-yielding animals. The ranking of farms according to score on agricultural land occupation (ALO) depended upon assumptions set for land use in the production of concentrate ingredients. When the Ecoinvent procedure of weighting according to the length of the cropping period was applied, milk and meat produced on diets with a high proportion of concentrates, scored better than milk and meat based on a diet dominated by forages. With regards to terrestrial ecotoxicity (TE), the score was mainly a function of the amount of concentrates fed per functional unit produced, and not of animal yield per se. Overall, the results indicated that an intensification of dairy production by means of higher yields per animal would contribute to more environment-friendly production. For GWP this was also the case when higher yields per head also resulted in higher milk yields and higher N inputs per area of land.
Due to the limited resources of fossil fuels and the need to mitigate climate change, energy utilisation for all human activity has to be improved. The objective of this study was to analyse the correlation between energy intensity on dairy farms and production mode, to examine the influence of machinery and buildings on energy intensity, and to find production related solutions for conventional and organic dairy farms to reduce energy intensity. Data from ten conventional and ten organic commercial dairy farms in Norway from 2010 to 2012 were used to calculate the amount of embodied energy as the sum of primary energy used for production of inputs from cradle-to-farm gates using a life cycle assessment (LCA) approach. Energy intensities of dairy farms were used to show the amount of embodied energy needed to produce the inputs per metabolizable energy in the output. Energy intensities allow to easily point out the contribution of different inputs. The results showed that organic farms produced milk and meat with lower energy intensities on average than the conventional ones. On conventional farms, the energy intensity on all inputs was 2.6 ± 0.4 (MJMJ?1) and on organic farms it was significantly lower at 2.1 ± 0.3 (MJ MJ?1). On conventional farms, machinery and buildings contributed 18% ± 4%, on organic farms 29% ± 4% to the overall energy use. The high relative contribution of machinery and buildings to the overall energy consumption underlines the importance of considering them when developing solutions to reduce energy consumption in dairy production. For conventional and organic dairy farms, different strategies are recommend to reduce the energy intensity on all inputs. Conventional farms can reduce energy intensity by reducing the tractor weight and on most of them, it should be possible to reduce the use of nitrogen fertilisers without reducing yields. On organic dairy farms, energy intensity can be reduced by reducing embodied energy in barns and increasing yields. The embodied energy in existing barns can be reduced by a higher milk production per cow and by a longer use of the barns than the estimated lifetime. In the long run, new barns should be built with a lower amount of embodied energy. The high variation of energy intensity on all inputs from 1.6 to 3.3 (MJ MJ?1) (corresponding to the energy use of 4.5e9.3 MJ kg-1 milk) found on the 20 farms shows a potential for producing milk and meat with lower energy intensity on many farms. Based on the results, separate recommendations were provided for conventional and organic farms for reducing energy intensity.
To improve environmental sustainability it is important that all sectors in a society contribute to improving the utilization of inputs as energy and nutrients. In Norway, dairy farming contributes with an important share to the added value from the agricultural sector, although there is little information available about utilization of energy and nitrogen (N). Many results on sustainability have been published on dairy farming. However, due to Norway’s Nordic climatic conditions, mountainous and rugged topography and an agricultural policy that can design its own prices and subsidies, results from other countries are hardly representative for Norwegian conditions. To bridge this gap, the objective of this study was to analyse if the utilisation of nitrogen and energy in dairy farming in Norway can be improved to strengthen its environmental sustainability. Data were collected from 2010 to 2012 on 10 conventional and 10 organic farms in a region in central Norway with dairy farming as the main enterprise. The farms varied in area, number of dairy cows and milk yield. For nitrogen, a farm gate balance was applied and supplemented with nitrogen fixation by clover and atmospheric N-deposition. The total farm area was broken down into three categories: dairy farm area utilized directly by the farm, off-farm area needed to produce imported roughages and concentrates, and free rangeland that only can be used for grazing.
I dette studiet analyserte vi miljøeffekter av å produsere erter og åkerbønner i et korndominert vekstskifte på en gård ved Oslofjorden ved hjelp av livsløpsanalyse (LCA). Miljøeffekter av høsthvetedyrking (samme gård) ble tatt med som referanse. Miljøeffektene ble uttrykt gjennom følgende ni miljøindikatorer; globalt oppvarmingspotensial, eutrofiering av ferskvann, eutrofiering av marine miljøer, økotoksisitet i ferskvann, terrestrisk forsuring, forbruk av fossil energi, human toksisitet, økotoksisitet i marine miljø og terrestrisk økotoksisitet. Systemgrensen ble definert til å være lik gårdens fysiske grense og analysen dekket alle de viktigste prosessene inkludert i omvandlingen fra råstoff til produkt leveringsklart ved gårdsgrinda («cradle to farmgate»). Studien omfattet også prosesser som ofte utelates i LCA-studier, slik som produksjon av maskiner, bygninger og produksjon og bruk av plantevernmidler, samt humusmineralisering og utslipp av NOx fra mineralgjødsel. Tidsperioden for analysen var ett fullt produksjonsår, og for alle data brukte vi gjennomsnittsverdier for tiåret 2001-2010. Funksjonell enhet var enten ett kilo lagringsklart produkt (85% tørrstoff) eller ett kilo protein. Når funksjonell enhet var per kg produkt ble det globale oppvarmingspotensialet for henholdsvis erter og åkerbønner 0,94 og 0,80 kg CO2-ekvivalenter, og dermed på nivå med det vi har funnet tidligere for norskprodusert korn. Med 1 kg protein som funksjonell enhet var tilsvarende verdier 5,0 og 3,1 kg CO2-ekvivalenter. Hvis dette proteinet i stedet skulle blitt produsert i form av melk eller kjøtt, ville oppvarmingspotensialet blitt vesentlig større. Basert på tall fra noen av våre tidligere studier med tilsvarende metodikk, kom vi fram til at oppvarmingspotensialet per kg protein er 9-15 ganger høyere for melk og 14-29 ganger høyere for kjøtt (fra melkeproduksjonen) enn tilsvarende for de to proteinvekstene analysert her. Når alle de ni miljøindikatorene ble sett under ett viste resultatene at proteinet i åkerbønner ble produsert med et gjennomgående lavere miljøforavtrykk enn tilsvarende i høsthvete. Erter var delvis bedre, delvis dårligere enn høsthveten. En gjennomgang av proteinvekstene og deres vekstpotensial i Norge viste at potensialet for erter og åkervekster ligger på omtrent 230 000 daa til sammen. Det må også nevnes at oljevekster representerer en potensielt stor proteinkilde, med en proteinkonsentrasjon i frøet på 20-25% og et potensielt dyrkingsareal på ca. 380 000 daa. Proteinet i oljevekster brukes i dag nærmest utelukkende til fôr. Den volummessig viktigste vekstgruppen i Norge for produksjon av protein nyttbart for mennesker er imidlertid korn, som har et proteininnhold på 11-15% og et potensielt dyrkbart areal på godt over 3,3 mill. daa. Lokalklima og vær utgjør den mest begrensende faktoren for produksjon av vegetabilsk protein her til lands i dag.
Embodied energy in barns is found to contribute to about 10–30% of total energy use on dairy farms. Nevertheless, research on sustainability of dairy farming has largely excluded consideration of embodied energy. The main objectives of this study were to apply an established model from the residential and commercial building sector and estimate the amount of embodied energy in the building envelopes on 20 dairy farms in Norway. Construction techniques varied across the buildings and our results showed that the variables which contributed most significantly to levels of embodied energy were the area per cow-place, use of concrete in walls and insulation in concrete walls. Our findings are in contrast to the assumption that buildings are similar and would show no significant differences. We conclude that the methodology is sufficiently flexible to accommodate different building design and use of materials, and allows for an efficient means of estimating embodied energy reducing the work compared to a mass material calculation. Choosing a design that requires less material or materials with a low amount of embodied energy, can significantly reduce the amount of embodied energy in buildings.