Stefano Puliti
Forsker
Forfattere
Xinlian Liang Yinrui Wang Jun Pan Janne Heiskanen Ningning Wang Siyu Wu Ilja Vuorinne Jiaojiao Tian Jonas Troles Myriam Cloutier Stefano Puliti Aishwarya Chandrasekaran James Ball Xiangcheng Mi Guochun Shen Kun Song Guofan Shao Rasmus Astrup Yunsheng Wang Petri Pellikka Mi Wang Jianya GongSammendrag
Accurate individual tree delineation (ITD) is essential for forest monitoring, biodiversity assessment, and ecological modeling. While remote sensing (RS) has significantly advanced forest ITD, challenges persist, especially in complex forest environments. The use of imagery data is compelling given the rapid increase in available high-resolution aerial and satellite imagery data, the increasing need for image-based analysis where reliable 3D data are unavailable, the widening gap between data supply and processing capabilities, and the limited validation of state-of-the-art (SOTA) methods across diverse real-world conditions. This study aims to advance ITD research by evaluating SOTA instance segmentation approaches, including both recently developed and established methods. The analysis evaluates ITD algorithm performance using the largest forest instance-segmentation imagery dataset to date and standardized evaluation protocols. This study identifies key factors affecting accuracy, reveals remaining challenges, and outlines future research directions. Findings in this study reveal that ITD accuracy is heavily influenced by image resolution, forest structure, and method design. Findings also reveal that, while algorithm innovations remain important, robustness and transferability that ensure generalization across diverse environments are what differentiate method performances. In addition, this study highlights that commonly used evaluation metrics may fail to adequately capture precise performance in specific applications, e.g., individual-tree-crown segmentation in this study. Assessment reliability can be strengthened through the adoption of stricter criteria. Future research should focus on expanding datasets, refining evaluation protocols, and developing adaptive models capable of handling varying canopy structures. These advancements will enhance ITD scalability and reliability, contributing to more effective forest research and management at a global scale.
Forfattere
Stefano Puliti Binbin Xiang Maciej Wielgosz Eivind Handegard Nicolas Cattaneo Marta Vergarechea Terje Gobakken Juha Hyyppä Erik Næsset Mikko Vastaranta Tuomas Yrttimaa Rasmus AstrupSammendrag
Accurately determining the age of individual trees is important for understanding forest dynamics, tree growth, site productivity and describing ecological processes. Traditional methods, such as dendrochronological coring, are invasive, labor-intensive, and costly. This study investigates the use of deep learning (DL) to predict tree age from high-density laser scanning data as a scalable, non-invasive alternative. The dataset includes approximately 1700 tree point clouds from approx. 1 K trees across Norway, Sweden, and Finland, encompassing Norway spruce (Picea abies) and Scots pine (Pinus sylvestris) and a broad range of tree age and developmental stages, from young seedlings (1 year) to old trees (∼350 years). Data were collected using terrestrial, mobile, and high-density airborne laser scanning platforms, enabling the development of sensor-agnostic models. We evaluated multiple modelling approaches, from linear regression to transformer architectures, using both training-from-scratch and fine-tuning strategies. Models fine-tuned starting from pre-trained weights from ForestFormer3D's U-Net as well as the transformer architecture (PointTransformerV3) trained from scratch, proved effective for age regression (RMSE ≤23 years). Although our analysis was limited to two tree species, we demonstrated that a single joint age-estimation model can be successfully trained for both species. We demonstrate that models trained on high-resolution data can generalize to lower-resolution, less costly inputs, provided that data augmentations that mimic reduced resolutions are included during training. This study presents a data-driven framework for estimating tree age without destructive sampling. The findings support the potential for AI-based methods to complement or replace traditional age estimation techniques in forest inventory and monitoring.
Forfattere
L. Duncanson P. M. Montesano A. Neuenschwander A. Zarringhalam N. Thomas D. M. Minor M. A. Wulder J. C. White E. Guenther T. Feng V. Leitold S. Hancock J. Armston Stefano Puliti A. I. Mandel S. Shah C. Silva M. Purslow J. Bruening Johannes Breidenbach Erik Næsset Svetlana Saarela N. Hunka J. R. Kellner S. P. Healey D. Schepaschenko J. Wallerman C. S. R. Neigh N. Carvalhais R. DubayahSammendrag
Forest aboveground biomass Density (AGBD) maps provide important constraints on climate and carbon cycle models and enable the long-term monitoring of carbon stocks. NASA's latest spaceborne lidar instruments provide unprecedented observations of forest structure that are used to compile spatially continuous, locally trained maps of circa 2020 AGB density and stock. To address a geographical limitation of the International Space Station deployed GEDI instrument, herein we map high northern latitude forests with a fusion of NASA's ICESat-2 mission, Harmonized Landsat Sentinel-2 (HLS), and Copernicus GLO-30 topographic data. We report a domain-wide estimate for boreal forests of 72.96 +/− 0.61 Pg AGB. Combining these maps with those of tropical and temperate forests from GEDI products provides a global estimate of 2020 biomass stocks of 593.49 +/− 11.47 Pg AGB. We analyze biomass means and totals across the boreal domain in different land cover types, slope classes, and ecoregions. We compare these products to national estimates of AGB stocks for high latitude countries, finding good general agreement between national reports and EO-based estimates, particularly for countries with robust National Forest Inventories (NFIs) and boreal forests, while underestimation of high AGBD in tall, dense forests remains a challenge for AGBD mapping. Satellite products can be used to support wide area estimation of aboveground biomass, and the maps described here provide insights into carbon stocks, patterns, and dynamics at scales relevant to forest management. These open access data products serve as a baseline to assess future changes associated with drought, fire, insects, deforestation, and degradation.
Divisjon for skog og utmark
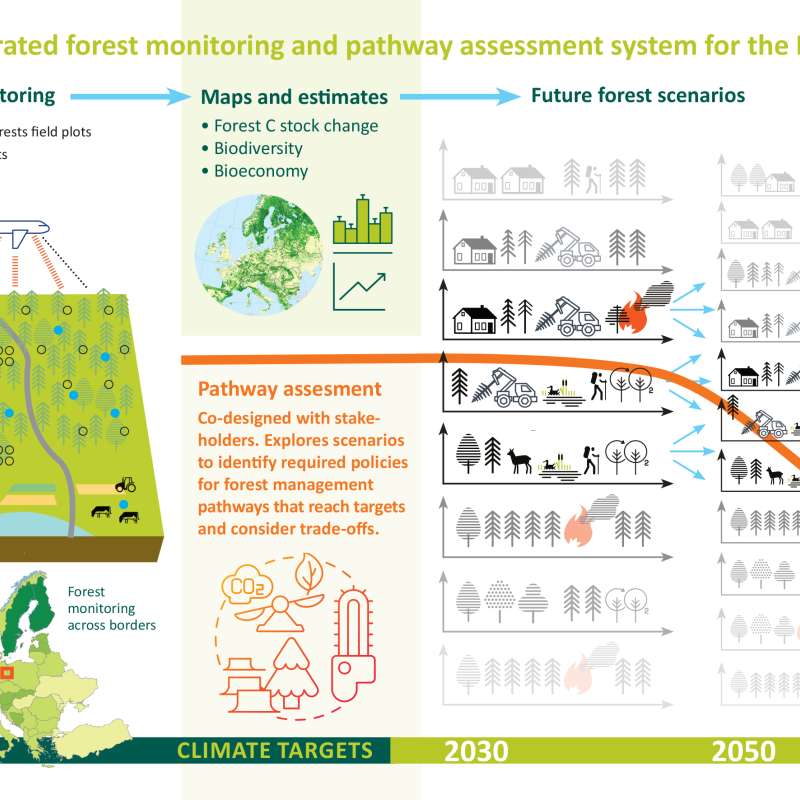
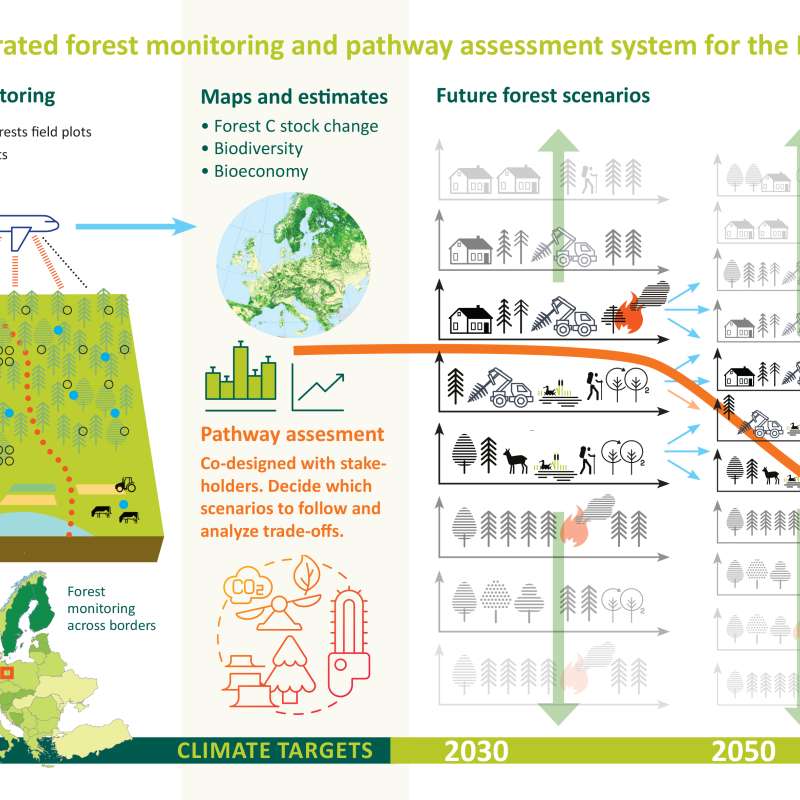
PathFinder - Towards an Integrated Consistent European LULUCF Monitoring and Policy Pathway Assessment Framework
Divisjon for skog og utmark
A Decision Support System for emerging forest management alternatives
This project aims to develop advanced tree growth models using LiDAR-derived, high-density point cloud data to improve the simulation of forest dynamics under close-to-nature silvicultural practices. By modeling tree-level growth in structurally complex and heterogeneous stands, these models will support more accurate, spatially explicit forest simulations and inform sustainable and diversified forest management decisions.
Divisjon for skog og utmark
PathFinder
Towards an Integrated Consistent European LULUCF Monitoring and Policy Pathway Assessment Framework
Divisjon for skog og utmark
SFI SmartForest: Bringing Industry 4.0 to the Norwegian forest sector
SmartForest will position the Norwegian forest sector at the forefront of digitalization resulting in large efficiency gains in the forest sector, increased production, reduced environmental impacts, and significant climate benefits. SmartForest will result in a series of innovations and be the catalyst for an internationally competitive forest-tech sector in Norway. The fundamental components for achieving this are in place; a unified and committed forest sector, a leading R&D environment, and a series of progressive data and technology companies.