Johannes Breidenbach
Avdelingsleder/forskningssjef
(+47) 974 77 985
johannes.breidenbach@nibio.no
Sted
Ås - Bygg H8
Besøksadresse
Høgskoleveien 8, 1433 Ås
Forfattere
Giovanni D’Amico Davide Botticelli Giacomo Marcelli Walter Mattioli Gherardo Chirici Elia Vangi Costanza Borghi Piermaria Corona Johannes Schumacher Johannes Breidenbach Yang Su Lauri Mehtätalo Saverio FranciniSammendrag
This data article presents a multi-source dataset of satellite-based auxiliary data designed for forest modelling and monitoring. The dataset integrates annual medoid composites derived from Sentinel-1, Sentinel-2, and Landsat imagery, together with spectral indices, Landsat-based 3I3D change metrics, forest mask and forest type layers, and terrain variables derived from the Copernicus GLO-30 DEM, offering comprehensive information on forest cover, spectral behavior, and change metrics. It provides harmonized predictors across seven European countries, ensuring consistency, scalability, and ease of use for researchers developing or validating models to understand forest dynamics and estimate forest-related variables such as biomass or canopy recovery. A curated subset of the dataset is distributed via Zenodo, along with direct public access links to the complete multi-terabyte archive. The data support applications in forest biodiversity conservation, carbon monitoring, biomass modelling, and climate-change impact assessment.
Forfattere
Daniel Moreno-Fernández Patricia Adame Johannes Breidenbach Isabel Cañellas Christoph Fischer Kari T. Korhonen Jan Máslo Nerea Oliveira John Redmond Thomas Riedel Mitja Skudnik Iciar AlberdiSammendrag
Forest diversity is a multidimensional concept comprising different components such as species diversity, functional diversity, structural diversity and genetic diversity. These diverse elements are recognised as being connected to the health and functioning of forest ecosystems and human well-being. However, information on forest diversity at broad spatial scales is scarce. Thus, the primary goal of this study is to quantify compositional diversity (i.e., tree species heterogeneity) and structural diversity (i.e., tree size heterogeneity) across a wide climatic gradient in European forest ecosystems, while also examining the influence of forest attributes and climatic variables on these two key components of forest diversity. Using harmonised data from eight European National Forest Inventories (n = 146,235 plots), we calculated Shannon’s Diversity Index as a measure of compositional and structural diversity. Finally, we estimated measures of forest diversity at three spatial scales ( α , β and γ -diversity) for each country. Basal area was positively related to compositional and structural diversity. In contrast, the quadratic mean diameter of the trees in each plot presented both positive and negative relationships with compositional and structural diversity, respectively. Climatic variables played a minor role, with precipitation and temperature showing a positive association with forest compositional and structural diversity. Furthermore, our findings revealed a positive link between compositional and structural diversity. Finally, the compound analyses of α , β , and γ-diversity emerged as key elements in interpreting compositional patterns at landscape scale. Results revealed strong scale dependence (from local to landscape level) in diversity metrics across countries, thereby highlighting the importance of reporting national forest information at multiple spatial scales.
Forfattere
Johannes Schumacher Alessandro Cescatti Gherardo Chirici Giovanni D’Amico Saverio Francini Johannes Hertzler Lauri Mehtätalo Gert-Jan Nabuurs Mats Nilsson Juho Pitkänen Johannes BreidenbachSammendrag
The availability of reliable ground-truth data is one of the main bottlenecks for improving high-resolution forest attribute maps from Earth observation data. This is underpinned by the European Union (EU) Forest Strategy for 2030 that underscores the need for harmonized, cross-border forest resource assessments that integrate both remote sensing and field-based National Forest Inventory (NFI) data. However, confidentiality constraints on NFI plot coordinates present a significant barrier to aligning these datasets, thereby limiting the development of unified forest monitoring systems that can fully leverage the potential of Earth Observation data. To overcome these data-sharing limitations we explored the effectiveness of a privacy-enhancing technique, known as Federated Learning (FL), that is a form of distributed computing aimed at preserving the privacy and confidentiality of data owned by different organizations. This methodology has been tested for the collaborative modelling and mapping of forest timber volume across four European countries: Norway, Sweden, Finland, and Italy. We employed a time-series convolutional neural network (CNN) architecture tailored to integrate 40 years of Landsat or 7 years of Sentinel imagery and terrain variables with harmonized NFI data from more than 85,000 sample plots. This model architecture was used for the FL approach and compared to traditional country-specific and centralized modelling strategies. FL models achieved predictive performances comparable to the traditional models, which proofs the effectiveness of the proposed approach. Centralized or global models showed slightly reduced performance compared to the national models, highlighting the value of fine-tuning with local ground-truth data. By aligning with the EU’s forest monitoring objectives, FL facilitates the generation of harmonized models and maps of forest features, like timber volume and biomass, that are critical to support evidence-based forest policy and management. The findings underscore the potential of FL to transform collaborative environmental monitoring, particularly in domains where data confidentiality and interoperability are critical.
Divisjon for skog og utmark
INFOBIOM – Nordic network for integrated forest resource and biodiversity monitoring
INFOBIOM is a SNS-funded network of Nordic researchers that brings together experts in forest monitoring and biodiversity. The network is led by Johannes Breidenbach (NIBIO) and includes NINA, LUKE, SYKE, SLU, and Uni Copenhagen as partners.
Divisjon for skog og utmark
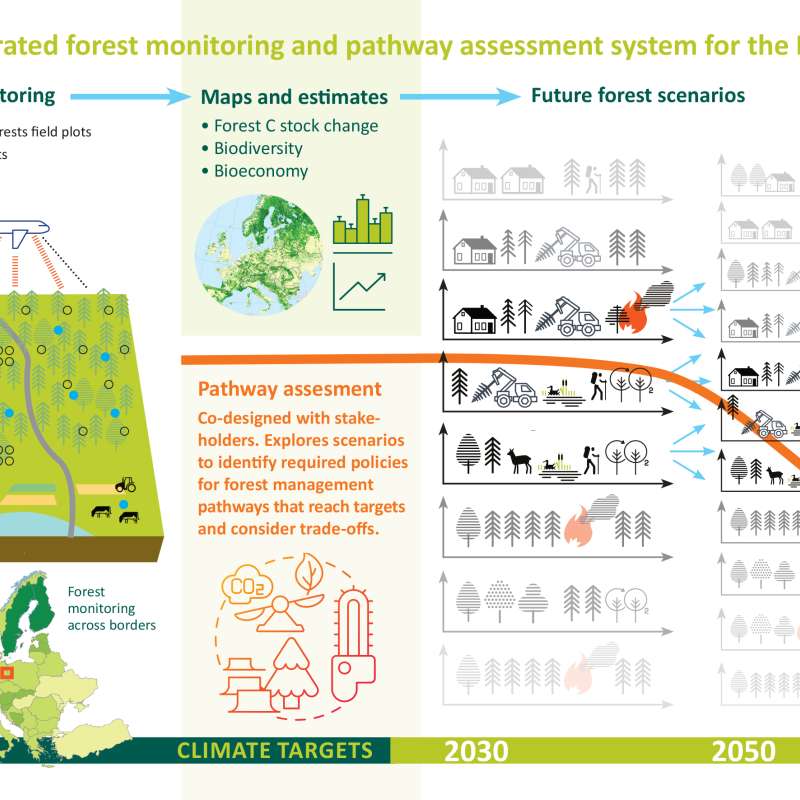
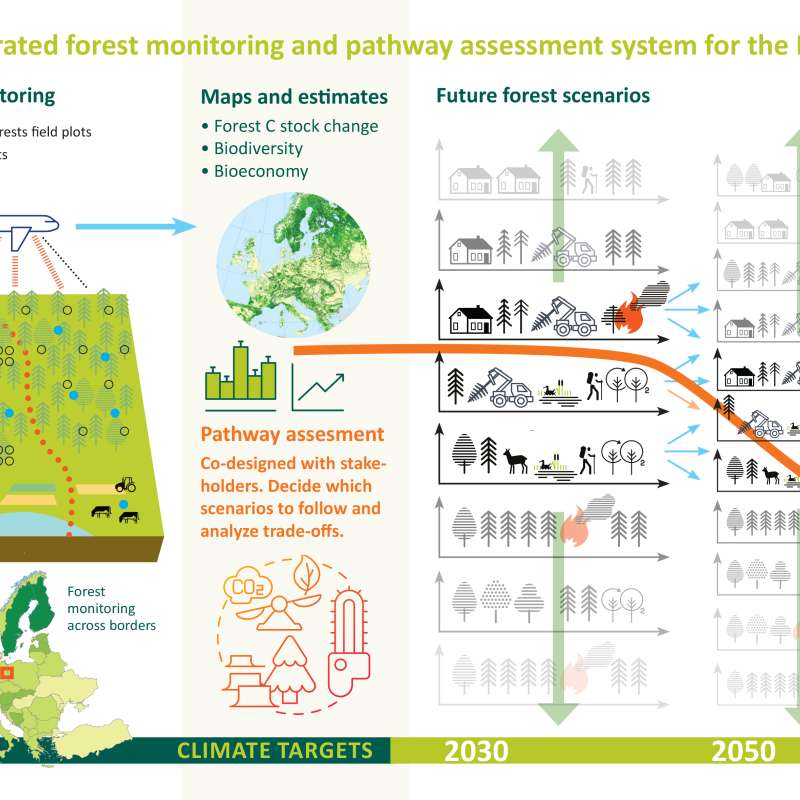
PathFinder - Towards an Integrated Consistent European LULUCF Monitoring and Policy Pathway Assessment Framework
Divisjon for skog og utmark
PathFinder
Towards an Integrated Consistent European LULUCF Monitoring and Policy Pathway Assessment Framework