Rasmus Astrup
Forskningssjef
Forfattere
Marta Vergarechea C Antón-Fernández J.U Jepsen Ole Petter Laksforsmo Vindstad Nicolas Cattaneo J.J Camarero Rasmus AstrupSammendrag
resilience. In Norway, birch species (Betula pendula and Betula pubescens) dominate large areas of boreal forest, yet large-scale patterns of their age distribution and growth dynamics remain poorly quantified. Using increment core data from 2818 trees sampled across the Norwegian National Forest Inventory, spanning five vegetation zones (58–71◦N) and a broad productivity gradient, we analyzed the drivers of birch age structure and growth variation across age classes and historical cohorts. Intermediate-aged trees (35–80 years) dominated most regions, whereas older individuals were scarce, particularly on productive sites, reflecting the combined effects of forest management and the life-history strategy of fast-growing pioneer species. When compared at equivalent biological ages, younger trees consistently showed higher basal area increment (BAI) than older trees, with differences strongest during early development and on productive sites. Cohort analyses showed a pronounced long-term increase in juvenile growth: mean BAI during the first ten years after reaching breast height increased steadily across successive cohorts over the past 150 years. This increase became more pronounced after ~1960 and was consistent across vegetation zones and site productivity classes. Although sampling and survivor bias cannot be fully excluded, the consistency across environmental gradients points to broad-scale changes in early growth dynamics of birch forests in Norway. These results underscore the importance of considering both age structure and cohort-related variation when interpreting forest dynamics and planning future management.
Forfattere
Clemens Mosig Janusch Vajna-Jehle Miguel D. Mahecha Yan Cheng Henrik Hartmann David Montero Samuli Junttila Stéphanie Horion Mirela Beloiu Schwenke Michael J. Koontz Khairul Nizam Abdul Maulud Stephen Adu-Bredu Djamil Al-Halbouni Muhammad Ali Matthew Allen Jan Altman Lot Amorós Claudia Angiolini Rasmus Astrup Hassan Awada Caterina Barrasso Harm Bartholomeus Pieter S.A. Beck Aurora Bozzini Joshua Braun-Wimmer Benjamin Brede Fabio Marcelo Breunig Stefano Brugnaro Allan Buras Vicente Burchard-Levine Jesús Julio Camarero Anna Candotti Luka Capuder Erik Carrieri Mauro Centritto Gherardo Chirici Myriam Cloutier Dhemerson Conciani KC Cushman James W. Dalling Phuong D. Dao Jan Dempewolf Martin Denter Marcel Dogotari Ricardo Díaz-Delgado Simon Ecke Jana Eichel Anette Eltner André Fabbri Maximilian Fabi Fabian Fassnacht Matheus Pinheiro Ferreira Fabian Jörg Fischer Julian Frey Annett Frick Jose Fuentes Selina Ganz Matteo Garbarino Milton García Matthias Gassilloud Antonio Gazol Guillermo Gea-Izquierdo Kilian Gerberding Marziye Ghasemi Francesca Giannetti Jeffrey Gillan Roy Gonzalez Carl Gosper Terry Greene Konrad Greinwald Stuart Grieve André Große-Stoltenberg Jesus Aguirre Gutierrez Anna Göritz Peter Hajek David Hedding Jan Hempel Stien Heremans Melvin Hernández Marco Dietmar Heurich Eija Honkavaara Bernhard Höfle Robert Jackisch Tommaso Jucker Jesse M. Kalwij Sebastian Kepfer-Rojas Pratima Khatri-Chhetri Till Kleinebecker Hans-Joachim Klemmt Tomáš Klouček Niko Koivumäki Nagesh Kolagani Jan Komárek Kirill Korznikov Bartłomiej Kraszewski Stefan Kruse Robert Krüger Helga Kuechly Ivan H.Y. Kwong Etienne Laliberté Liam Langan Hooman Latifi Claudia Leal-Medina Jan R.K. Lehmann Linyuan Li Emily Lines Maciej Lisiewicz Javier Lopatin Arko Lucieer Antonia Ludwig Marvin Ludwig Päivi Lyytikäinen-Saarenmaa Qin Ma Nicolas Mansuy José Manuel Peña Giovanni Marino Michael Maroschek M.Pilar Martín Darío Martín-Benito Pavan Matham Sabrina Mazzoni Fabio Meloni Annette Menzel Hanna Meyer Mojdeh Miraki Gerardo Moreno Daniel Moreno-Fernández Helene C. Muller-Landau Mirko Mälicke Jakobus Möhring Jana Müllerova Setti Sridhara Naidu Davide Nardi Paul Neumeier Mihai Daniel Nita Roope Näsi Lars Oppgenoorth Sagynbek Orunbaev Melanie Palmer Thomas Paul Mattis Pfenning Alastair Potts Gudala Laxmi Prasanna Suzanne Prober Stefano Puliti Antonio J. Pérez-Luque Oscar Pérez-Priego Chris Reudenbach Jesús Revuelto Gonzalo Rivas-Torres Philippe Roberge Pier Paolo Roggero Christian Rossi Nadine Katrin Ruehr Paloma Ruiz-Benito Christian Mestre Runge Gabriele Giuseppe Antonio Satta Bruno Scanu Michael Scherer-Lorenzen Felix Schiefer Christopher Schiller Jacob Schladebach Marie-Therese Schmehl Jonathan Schmid Tristan Alexander Schmidt Selina Schwarz Rupert Seidl Thomas Seifert Ana Seifert Barba Elham Shafeian Aurélie Shapiro Leopoldo de Simone Hormoz Sohrabi Salim Soltani Laura Sotomayor Ben Sparrow Benjamin S.C. Steer Matt Stenson Benjamin Stöckigt Yanjun Su Juha Suomalainen Elisa Tamudo Mauro J. Tognetti Barbieri Enrico Tomelleri Michele Torresani Katerina Trepekli Saif Ullah Sami Ullah Josefine Umlauft Nicolás Vargas-Ramírez Can Vatandaslar Vladimir Visacki Michele Volpi Vicente Vásquez Christine Wallis Ben Weinstein Hannah Weiser Serge Wich Tagle Casapia Ximena Pablo J. Zarco-Tejada Katherine Zdunic Katarzyna Zielewska-Büttner Raquel Alves de Oliveira Liz van Wagtendonk Vincent von Dosky Teja KattenbornSammendrag
Excessive tree mortality is a global concern and remains poorly understood as it is a complex phenomenon. We lack global and temporally continuous coverage on tree mortality data. Ground-based observations on tree mortality, e.g., derived from national inventories, are very sparse, and may not be standardized or spatially explicit. Earth observation data, combined with supervised machine learning, offer a promising approach to map overstory tree mortality in a consistent manner over space and time. However, global-scale machine learning requires broad training data covering a wide range of environmental settings and forest types. Low altitude observation platforms (e.g., drones or airplanes) provide a cost-effective source of training data by capturing high-resolution orthophotos of overstory tree mortality events at centimeter-scale resolution. Here, we introduce deadtrees.earth, an open-access platform hosting more than two thousand centimeter-resolution orthophotos, covering more than 1,000,000 ha, of which more than 58,000 ha are manually annotated with live/dead tree classifications. This community-sourced and rigorously curated dataset can serve as a comprehensive reference dataset to uncover tree mortality patterns from local to global scales using space-based Earth observation data and machine learning models. This will provide the basis to attribute tree mortality patterns to environmental changes or project tree mortality dynamics to the future. The open nature of deadtrees.earth, together with its curation of high-quality, spatially representative, and ecologically diverse data will continuously increase our capacity to uncover and understand tree mortality dynamics.
Forfattere
Xinlian Liang Yinrui Wang Jun Pan Janne Heiskanen Ningning Wang Siyu Wu Ilja Vuorinne Jiaojiao Tian Jonas Troles Myriam Cloutier Stefano Puliti Aishwarya Chandrasekaran James Ball Xiangcheng Mi Guochun Shen Kun Song Guofan Shao Rasmus Astrup Yunsheng Wang Petri Pellikka Mi Wang Jianya GongSammendrag
Accurate individual tree delineation (ITD) is essential for forest monitoring, biodiversity assessment, and ecological modeling. While remote sensing (RS) has significantly advanced forest ITD, challenges persist, especially in complex forest environments. The use of imagery data is compelling given the rapid increase in available high-resolution aerial and satellite imagery data, the increasing need for image-based analysis where reliable 3D data are unavailable, the widening gap between data supply and processing capabilities, and the limited validation of state-of-the-art (SOTA) methods across diverse real-world conditions. This study aims to advance ITD research by evaluating SOTA instance segmentation approaches, including both recently developed and established methods. The analysis evaluates ITD algorithm performance using the largest forest instance-segmentation imagery dataset to date and standardized evaluation protocols. This study identifies key factors affecting accuracy, reveals remaining challenges, and outlines future research directions. Findings in this study reveal that ITD accuracy is heavily influenced by image resolution, forest structure, and method design. Findings also reveal that, while algorithm innovations remain important, robustness and transferability that ensure generalization across diverse environments are what differentiate method performances. In addition, this study highlights that commonly used evaluation metrics may fail to adequately capture precise performance in specific applications, e.g., individual-tree-crown segmentation in this study. Assessment reliability can be strengthened through the adoption of stricter criteria. Future research should focus on expanding datasets, refining evaluation protocols, and developing adaptive models capable of handling varying canopy structures. These advancements will enhance ITD scalability and reliability, contributing to more effective forest research and management at a global scale.
Divisjon for skog og utmark
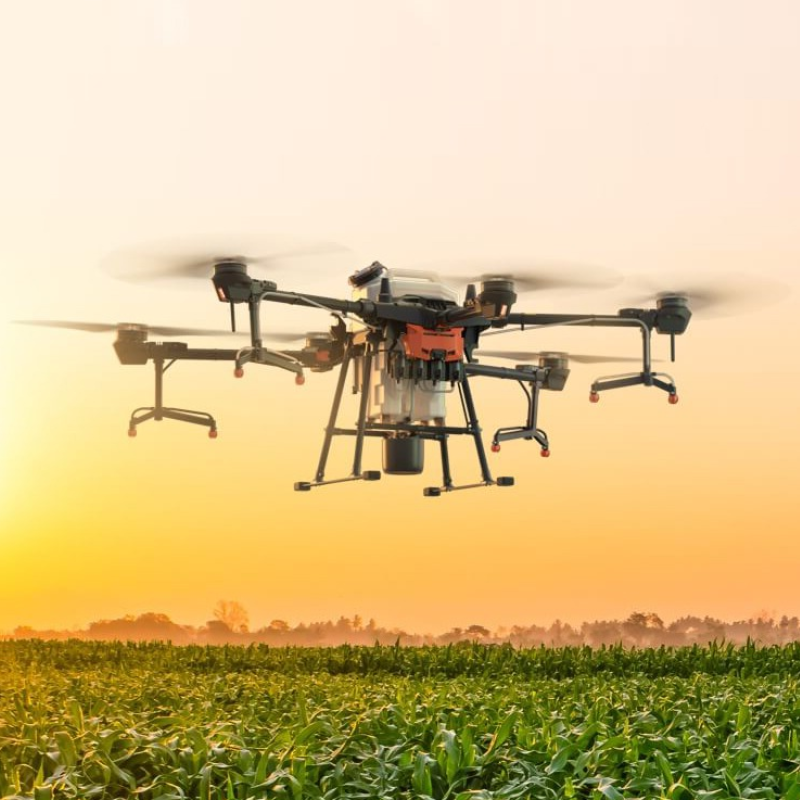
SPADE: Multi-purpose physical-cyber agri-forest drones ecosystem for governance and environmental observation
The strategic objective of SPADE project is to develop an intelligent ecosystem to address the multiple purposes concept in the light of deploying unmanned aerial vehicles (UAVs alias drones) to promote sustainable digital services for the benefit of a large scope of end users in sectors of crop production, forestry, and livestock. This includes individual UAV usability, UAV type applicability (e.g., swarm, collaborative, autonomous, tethered), UAV governance models availability and UAV-generated data trustworthiness.
Divisjon for skog og utmark
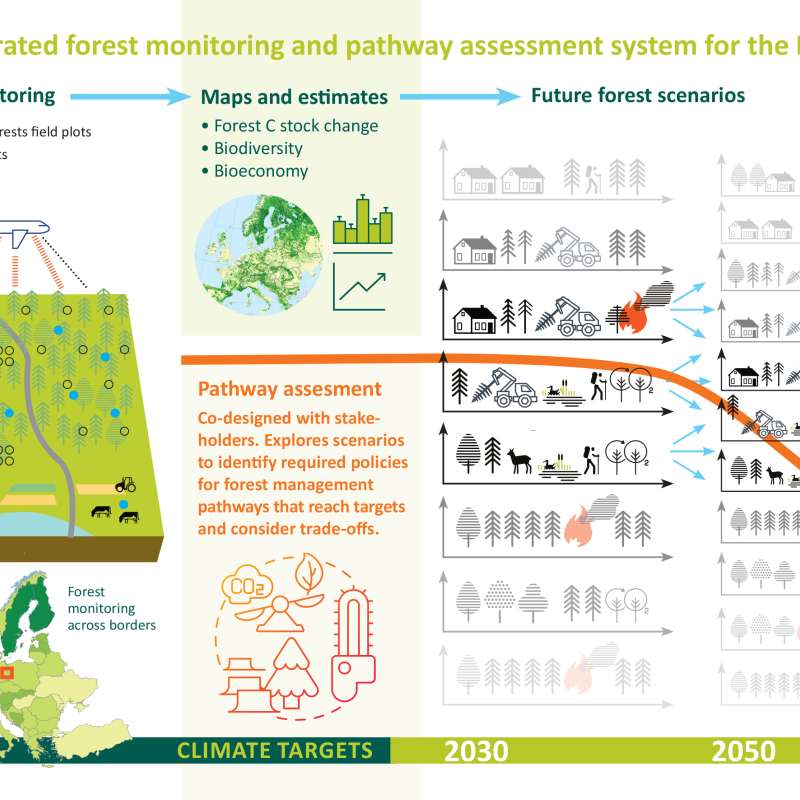
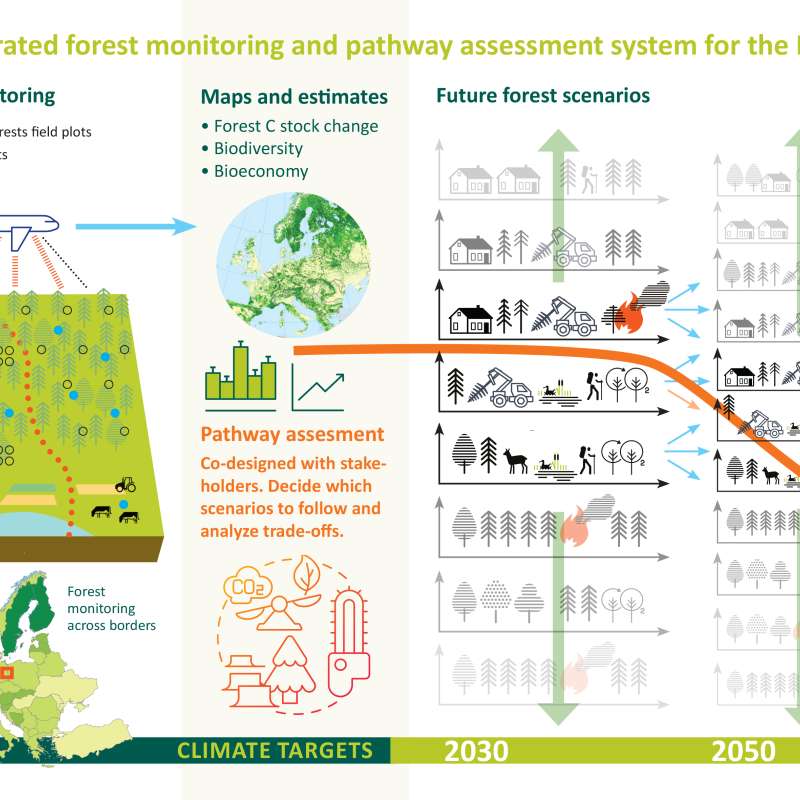
PathFinder - Towards an Integrated Consistent European LULUCF Monitoring and Policy Pathway Assessment Framework

Divisjon for kart og statistikk
A climate for spruce? New forest management to mitigate bark beetle risks under climate change
Divisjon for skog og utmark
PathFinder
Towards an Integrated Consistent European LULUCF Monitoring and Policy Pathway Assessment Framework
Divisjon for skog og utmark
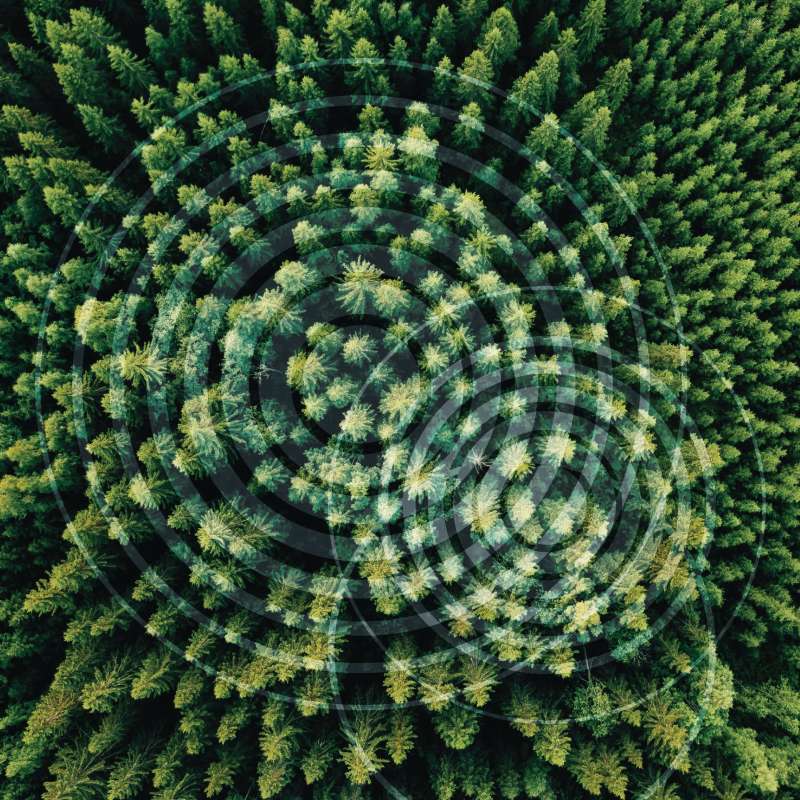
SFI SmartForest: Bringing Industry 4.0 to the Norwegian forest sector
SmartForest will position the Norwegian forest sector at the forefront of digitalization resulting in large efficiency gains in the forest sector, increased production, reduced environmental impacts, and significant climate benefits. SmartForest will result in a series of innovations and be the catalyst for an internationally competitive forest-tech sector in Norway. The fundamental components for achieving this are in place; a unified and committed forest sector, a leading R&D environment, and a series of progressive data and technology companies.