Stephanie Eisner
Forsker
Forfattere
Andreas Hagenbo Jogeir N. Stokland Terje Hoel Even Bergseng Lise Dalsgaard Christian Wilhelm Mohr Stephanie EisnerSammendrag
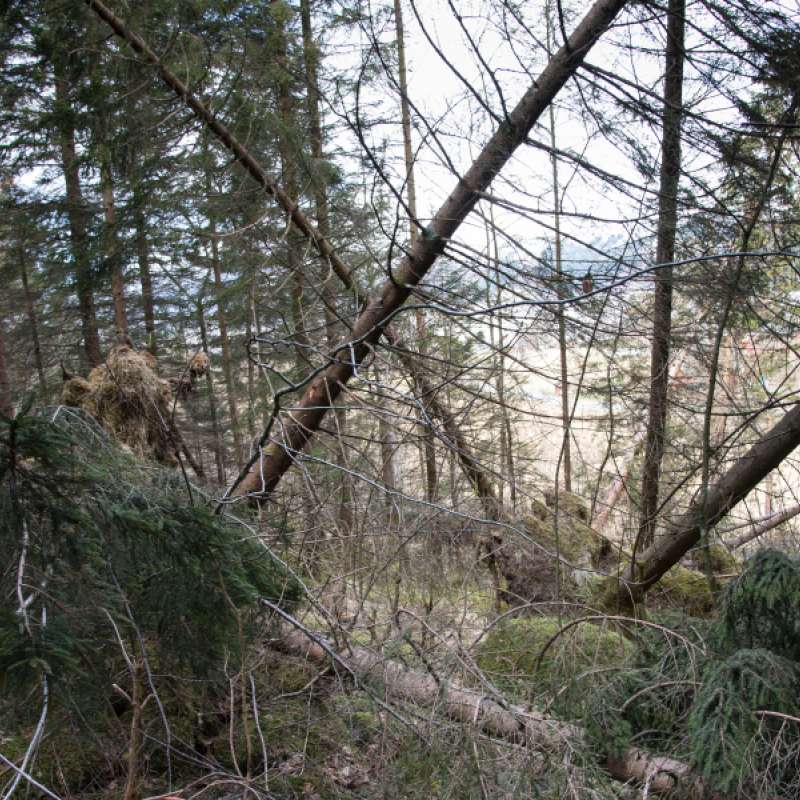
Grøfter i skog har blitt etablert for å bedre vekstforholdene på dårlig drenerte arealer. I dag er nygrøfting av myr og sumpskog for skogproduksjon forbudt, men vedlikehold av eksisterende grøfter – såkalt grøfterensk – er fortsatt aktuelt på produktiv skogsmark. Tiltaket er omdiskutert, særlig på grunn av mulige klimagassutslipp. Så hva betyr egentlig grøfterensk for klimaet?
Sammendrag
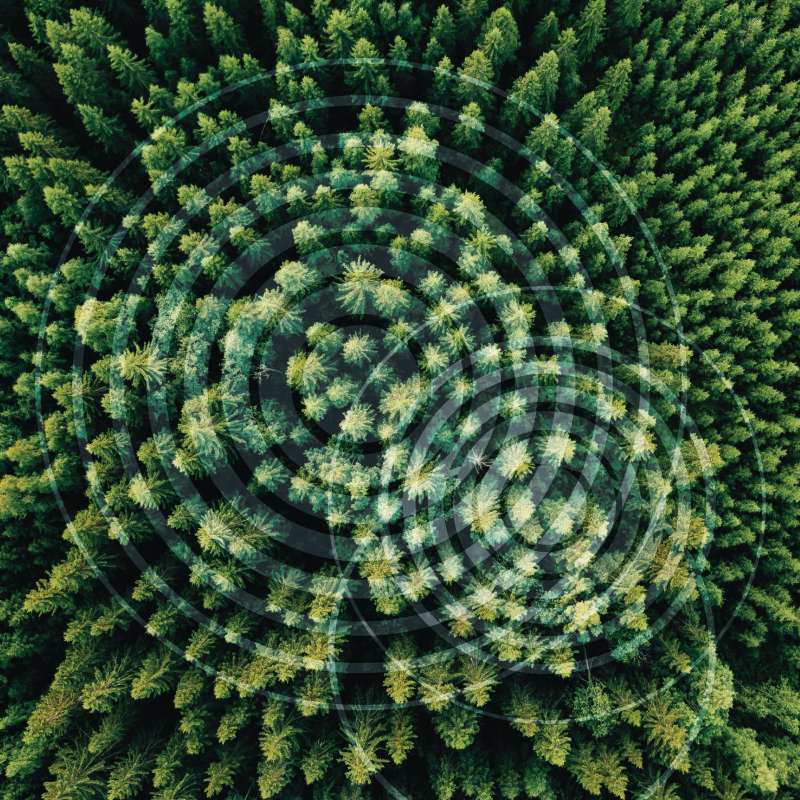
Soil disturbance following forestry operations is influenced by multiple factors. Reducing disturbance requires placing strip and base roads in locations with minimal risk of disturbance. However, identifying these areas is a complex task. To address this, we have begun developing a forwarding risk index ranging from 1 to 100 that integrates several geographical information sources in the area around Oslo. This forwarding index seems to provide good estimates of areas with a higher risk of ground disturbance during forwarding operations at the sites used for development. With further development of geographical inputs, their combination into a risk index, and later on nationwide validation, the forwarding risk raster combined with a terrain map could improve the identification of suitable areas for forwarding trails. The risk raster was tested for path planning and performed well in areas with a low to moderate frequency of high-risk pixels but was less effective in areas with a high concentration of high-risk pixels. In these areas, an assessment of the potential ecological impact (erosion, sedimentation of streams, mobilisation of mercury, soil carbon impact, changes in hydrology, soil compaction) of ground disturbance is needed alongside the risk index to determine the least unsuitable trail locations.
Sammendrag
Det er ikke registrert sammendrag

Divisjon for bioteknologi og plantehelse
FORESIGHT: Forest opportunities, risks and ecosystem services in a changing climate in Norway
Forest ecosystems are increasingly under pressure from climate change, emerging pests and pathogens, and more frequent extreme weather events. When such disturbances occur simultaneously—or interact with one another—the risk of severe damage can increase substantially. The FORESIGHT project aims to understand these complex, interacting challenges and to translate this knowledge into practical applications.
Divisjon for bioteknologi og plantehelse
FORESIGHT: Forest opportunities, risks and ecosystem services in a changing climate in Norway
Skog er i stadig større grad utsatt for press fra klimaendringer, nye skadegjørere og mer ekstremvær. Når slike forstyrrelser opptrer samtidig – eller påvirker hverandre – kan risikoen for store skader øke kraftig. FORESIGHT-prosjektet tar mål av seg til å forstå nettopp disse sammensatte utfordringene, og gjøre kunnskapen nyttig i praksis.
Divisjon for kart og statistikk
A climate for spruce? New forest management to mitigate bark beetle risks under climate change
Divisjon for skog og utmark
SFI SmartForest: Bringing Industry 4.0 to the Norwegian forest sector
SmartForest will position the Norwegian forest sector at the forefront of digitalization resulting in large efficiency gains in the forest sector, increased production, reduced environmental impacts, and significant climate benefits. SmartForest will result in a series of innovations and be the catalyst for an internationally competitive forest-tech sector in Norway. The fundamental components for achieving this are in place; a unified and committed forest sector, a leading R&D environment, and a series of progressive data and technology companies.