Trap catches per county
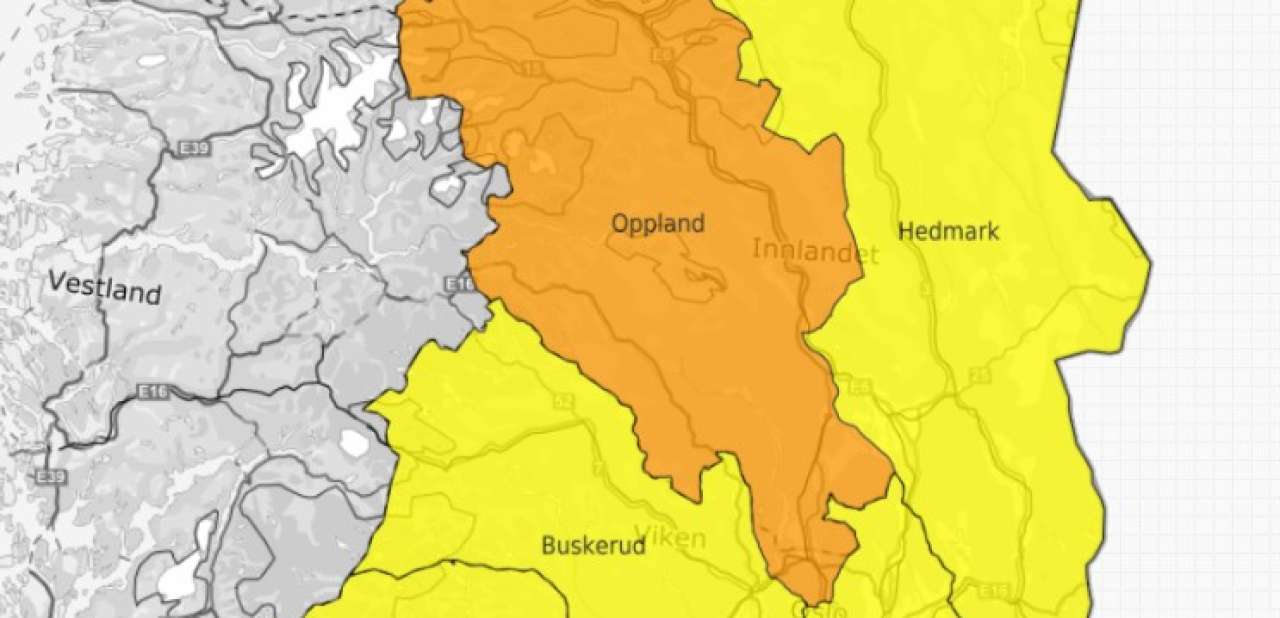
Monitoring of Ips typographus with pheromone traps has been ongoing every year since 1979. The color gradation in the map “Fylkesnivå barkbiller” shows current trap catches as a percentage of a provisional outbreak level (= trap catches in the hardest hit counties (Vestfold, Telemark, and Aust-Agder) at the end of the last bark beetle outbreak (1979-1980)). These were the last two years of a large Ips typographus outbreak in south-eastern Norway in the 1970’s.
If you click on a county, a box appears showing:
- Current year’s trap catches as a percentage of the outbreak level.
- A time series of average yearly trap catches for the whole county from the start of the bark beetle monitoring until today. Outbreak level is indicated by the horizontal dashed line.
By comparing trap catches for a large geographical area, such as a county, we reduce the effect of random variation between individual traps and localities.
Contacts

Paal Krokene
Research Professor
-
Division of Biotechnology and Plant Health
(+47) 995 16 013 paal.krokene@nibio.no Office Location: Ås H8
Links
To map layers in KildenContacts
Paal Krokene
Research Professor
-
Division of Biotechnology and Plant Health
(+47) 995 16 013 paal.krokene@nibio.no Office Location: Ås H8