Computer models to estimate environmental concentrations of pesticides
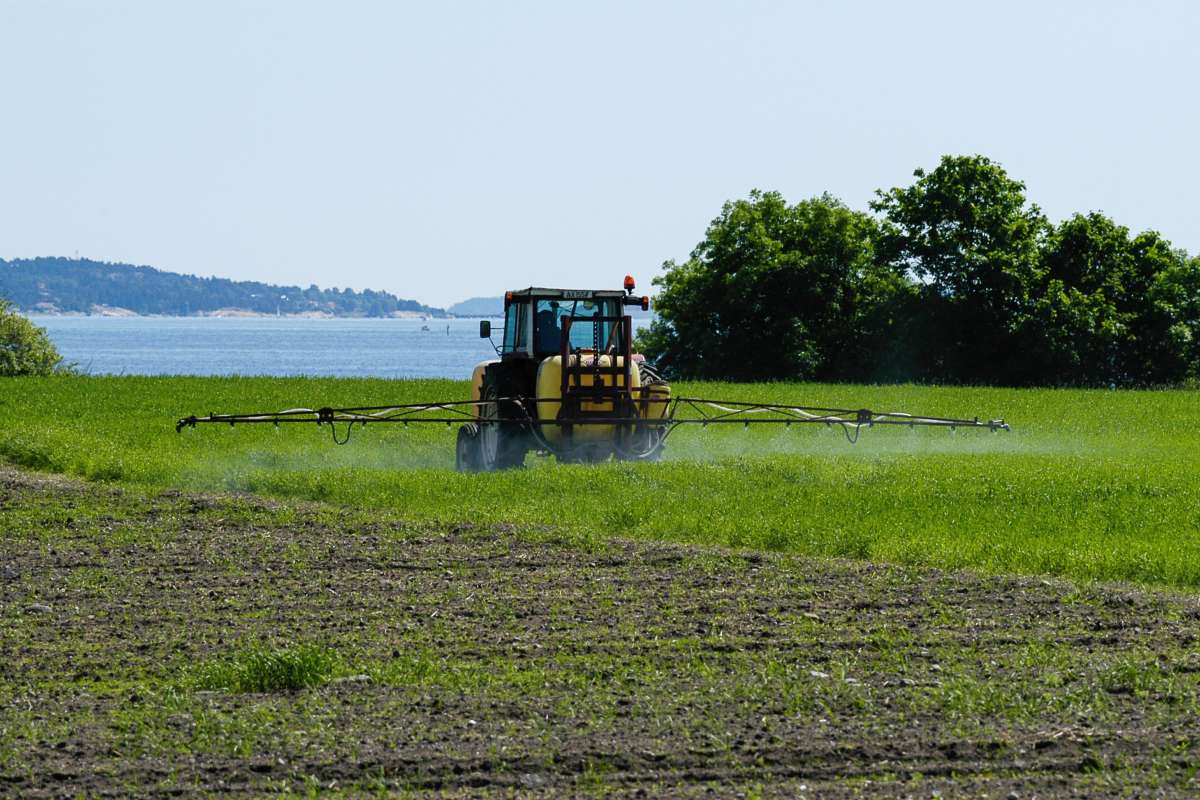
In order to assess the possible environmental effects of a pesticide, it is important to evaluate how the active substance will break down in water and soil, how it will be transported in soil and water, and what effects any exposure may have on soil and aquatic organisms.
There is only a limited number of studies that can be carried out to investigate what happens to the pesticides in nature because running experiments are both costly and time-consuming. Therefore, computer models have been developed as a supplement to the laboratory and field studies.
The use of computer models in the estimation of environmental exposure, i.e. estimation of pesticide concentrations in soil, groundwater and surface water, is particularly widespread as these predictions are often used further in the risk assessment for terrestrial and aquatic organisms such as earthworms, algae and fish. These estimates of concentrations in water or soil, so-called PEC values (Predicted Environmental Concentration) can then be compared with toxicity data for different organisms, such as EC50 or LD50 (EC – Effect Concentration, LD – Lethal Dose). In most computer models, scenarios have been developed, i.e. a collection of data that includes soil, climate, crops and plant development, which will represent a larger area. By selecting scenarios, and then specifying the type of pesticide, with data on, for example, decomposition and binding in soil, crop, application rates, application time, etc., one can then predict what will happen to a specific pesticide in a specific area. Often one can then choose a scenario from a list in the model, for example the Norwegian scenario Rustad in the leaching model MACRO or the scenario Syverud in the surface runoff model WISPE.
Here are some of the models NIBIO uses in our work to assess the fate of pesticides in the environment.
Leaching in soil
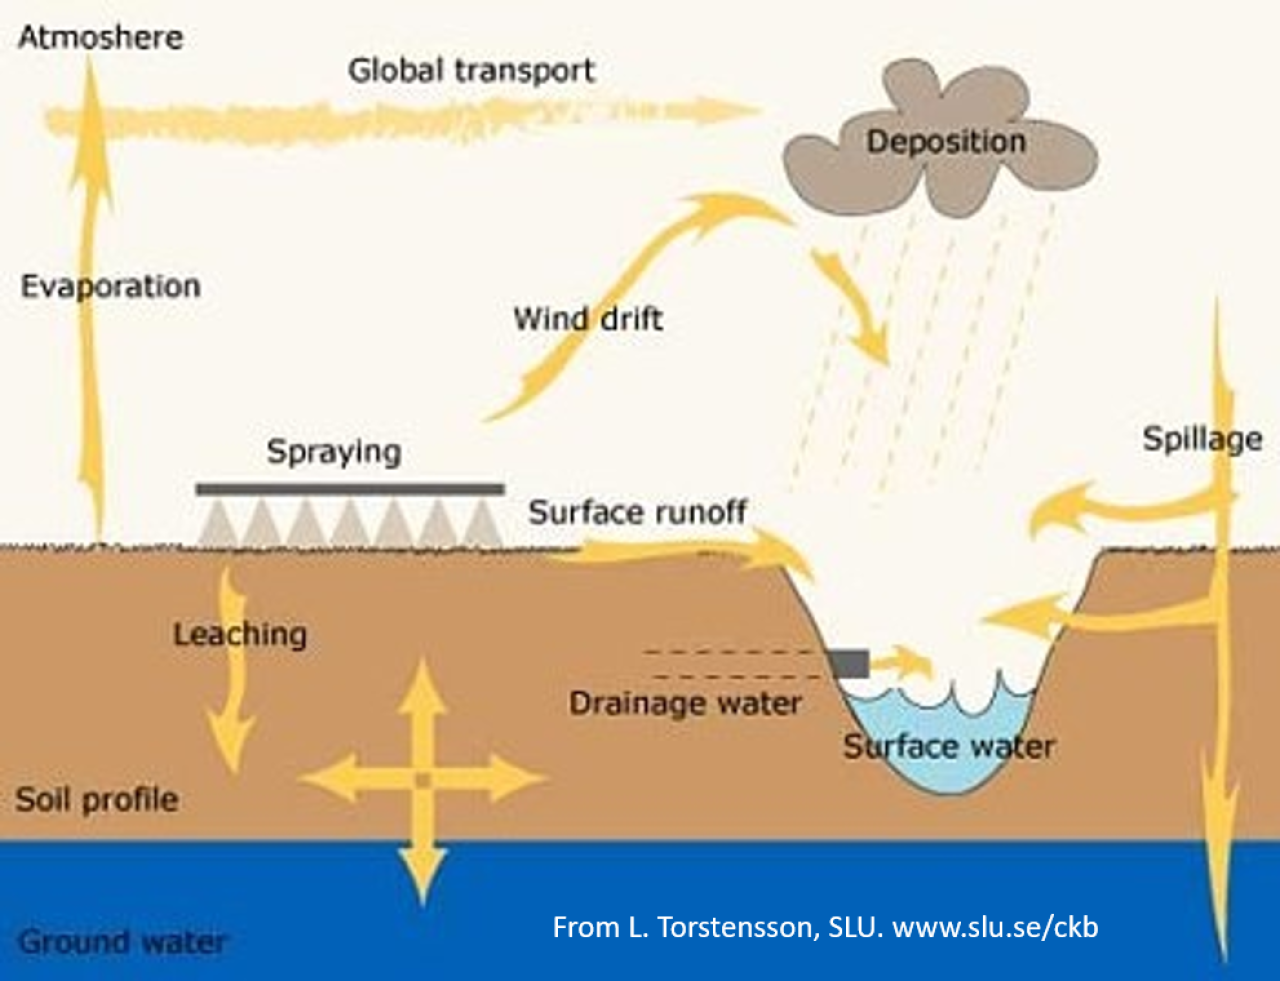
The groundwater model MACRO comes in different versions, but common to all of these is that they calculate a concentration of a pesticide on the way down into the soil, i.e. in the direction of groundwater/drainage water. Depending on the model version, the concentration in the soil water is estimated at a depth of 1-2 meters. One of the special things about MACRO is that it simulates the transport of pesticides in soil with macropores, i.e. larger pores/channels that are often made from earthworms or plant roots. These pores can conduct a lot of water in a short time downwards into the soil. The main model is described in detail on the websites of EU Joint Research Centre's website (JRC) or at the Swedish University of Agricultural Sciences (SLU).
MACRO 5.2 and 5.5.4
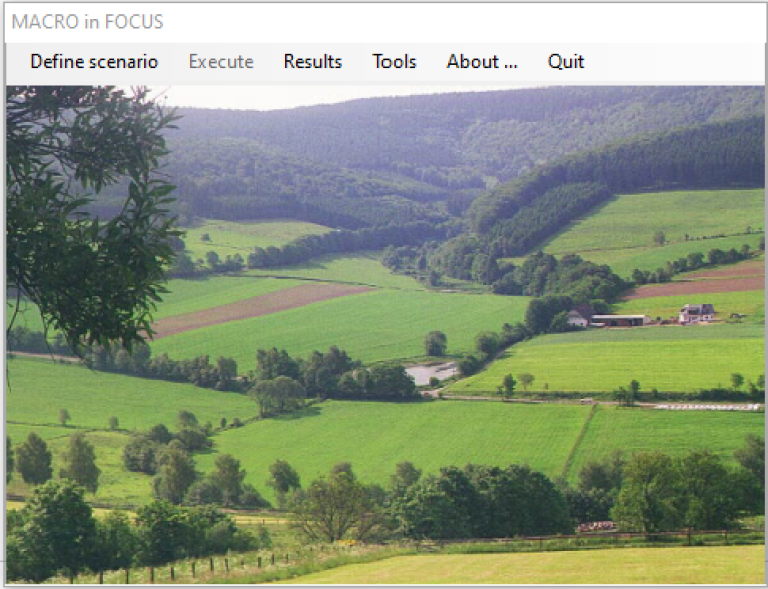
Separate Norwegian scenarios have been developed for use in MACRO 5.5.4, Rustad and Heia. The relevant data files for these scenarios can be uploaded to the model via the Norwegian Food Safety Authority's website. MACRO 5.5.4. is the version of MACRO used by the European Union (MACROinFOCUS) in the pesticide approval process. MACRO can also simulate leaching of substances other than pesticides as long as the correct input parameters are available, such as water solubility, sorption coefficient and half-life in soil and water for the substance in question. These properties can be extrapolated from other substances or estimated from other criteria or data. MACRO 5.5.4 is based on MACRO 5.2, which is a pure research version of the model.
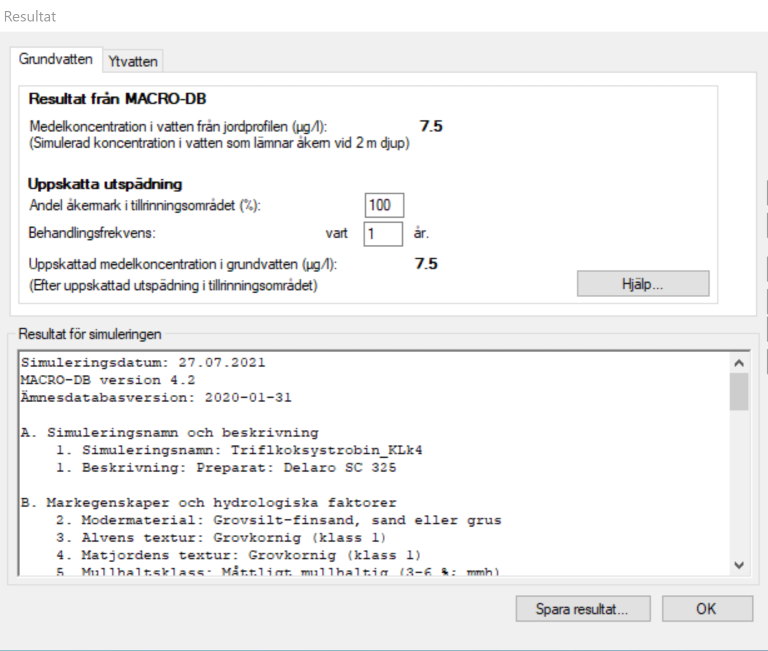
MACRO-DB
The model version MACRO-DB is a model developed to provide decision support in assessing the fate of pesticides and transport in soils, where different regions in Sweden are included with soil types and climate. This model is intended to be used by municipalities, councilors and farmers when applying for the use of pesticides in various water-protected areas. Here, too, NIBIO has incorporated Norwegian data on climate, soil types and cultural development for various major agricultural regions in Norway, so that we can simulate how pesticides are transported downwards into the soil. The project Pesticides - tables for leaching risk for use in spraying planning (see link at the bottom of the page) uses this model and the Norwegian regional scenarios for Rogaland and Sørlandet, Sør-Østlandet, Innlandet and Trøndelag.
Contacts

Roger Holten
Research Scientist
-
Division of Biotechnology and Plant Health
(+47) 915 92 762 roger.holten@nibio.no Office Location: Ås H7
You can download the WISPE model here
May 18th 2023
Runoff to surface water
SWASH
The model SWASH is used by EU authorities in the pesticide risk assessment process in order to assess the likelihood of runoff to surface water. The model consists of a shell with several submodels; PRZM which gives a concentration of a substance at the edge of a field, MACRO which simulates leaching towards the groundwater/drainage system and TOXSWA which, in simple terms, dilutes the concentrations in different water bodies so that the concentration can be directly compared to a toxicity value for aquatic organisms. The relevant surface water bodies are ditch, pond and stream/river, all with different catchments/runoff fields and different sizes/volumes. SWASH has various scenarios scattered around the EU, but none in Norway. The geographically closest scenarios are one scenario in Skåne (Lanna) and one in northern Germany (Hamburg). The scenarios elsewhere are scattered around the EU area and are supposed to represent larger agricultural areas within the EU. SWASH is under revision and a new version of the model is expected to launch in late 2023. Some countries, including Germany, have developed their own models and scenarios for estimating surface water exposure (German Runoff, Erosion and Drainage Risk Assessment - GERDA).
SWASH can be used in conjunction with the Surface Water Assessment Enabler, SWAN action model to perform a higher level exposure assessment (Step 4), which also takes into account measures such as drift reduction or the use of vegetation zones to reduce surface runoff.
WISPE
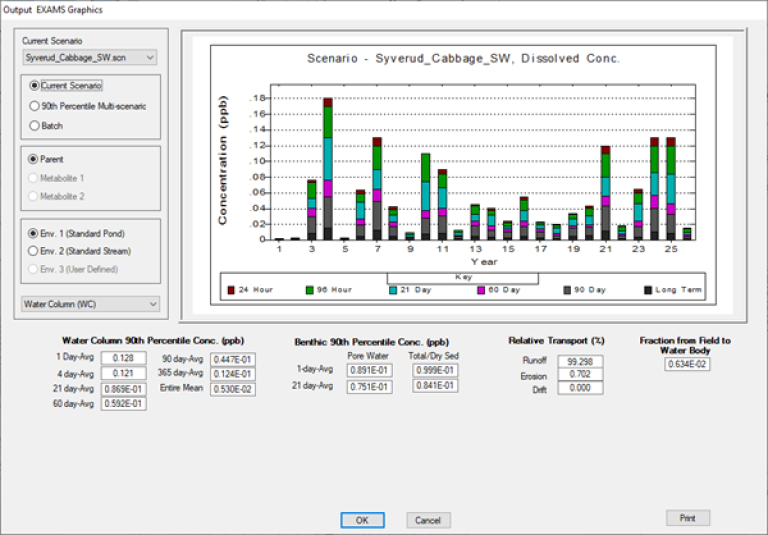
The WISPE – World Integrated Pesticide Exposure, model is developed by Waterborne Environmental, Inc. in the United States. In collaboration with NIBIO, a Norwegian version has been developed with Norwegian scenarios for both assessment of leaching into groundwater and surface runoff (Syverud, Bjørnebekk and Heia). This model is a shell with the PRZM and EXAMS models as "submodels", where PRZM calculates a pesticide concentration in the runoff water at the edge of a field, while EXAMS dilutes this concentration in different water bodies (ditch, pond, stream) with different volumes. This estimated concentration can then be compared directly with toxicity values for aquatic organisms. In the project Update of the WISPE model and the Norwegian surface water scenarios that was completed in June 2023, the purpose was to update the WISPE model and make it even more user-friendly both for regulators, industry and in research.
The WISPE modelling tool has been further developed, among other things, in accordance with updates recommended for EU models in the FOCUS-Repair project. The possibility of estimating the effect of vegetation zones of varying widths has also been added. The model has been modified to make it easier to further develop the tool and add new data without the use of programming experts, and it is easy to run the model with different climate files to look at the effects of climate change.
A user manual has been developed to make it easier to use the model. Waterborne Environmental has been responsible for programming and all technical development in this project. NIBIO has contributed with data and knowledge about Norwegian conditions, as well as testing and input along the way. Waterborne has gathered input from the pesticide industry as well as developers in Europe working on the EU models.
The results from the project have been disseminated at various international conferences and in a separate meeting with the Norwegian Food Safety Authority and a representative from the industry (Bayer CropScience). The main deliverable from the project is the updated modelling tool and the user manual. The actual model and final report with user manual can be downloaded from this page.
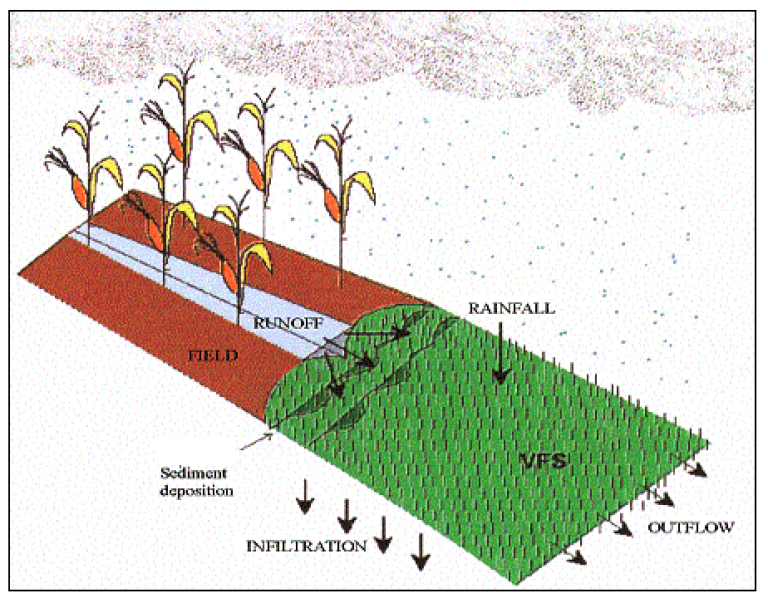
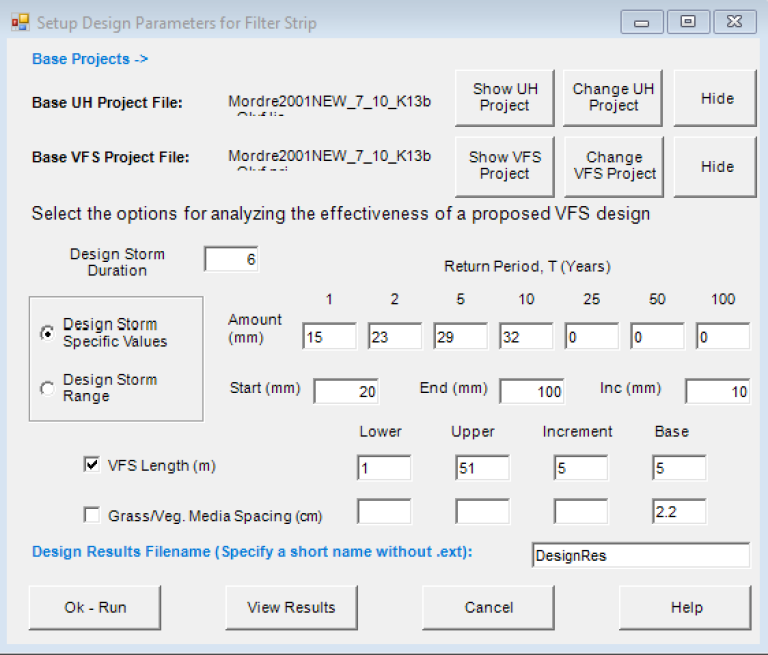
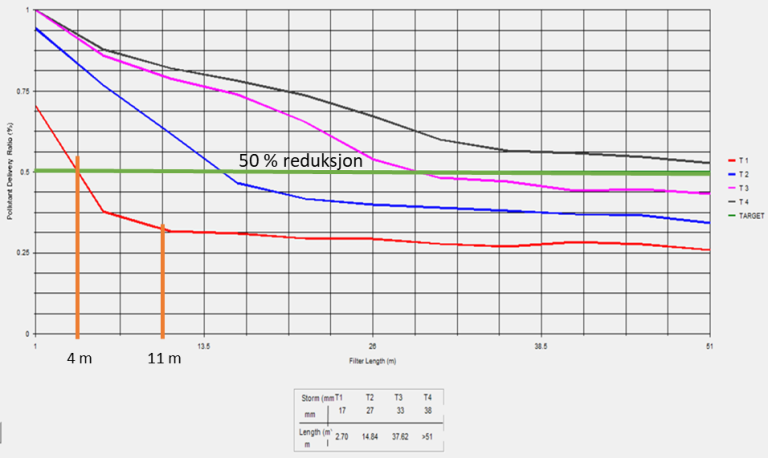
VFSMOD
The model VFSMOD (Vegetative Filter Strip Modeling System) is used in many contexts to estimate the effect of vegetation zones on the surface runoff of pesticides and it is included for example in the German model GERDA and can be used together with the surface runoff model PRZM and the action model SWAN. VFSMOD is so-called event-based, i.e. it simulates individual episodes of precipitation over time, where one can vary the precipitation intensity and see the effect of different types of vegetation zones, for example by varying width and vegetation density. This model has also been used in the NIBIO project "Data tools for planning vegetation zones for reduced pesticide runoff", which was completed in 2020. In this project, data on pesticide runoff under Norwegian conditions were used to calibrate the model.
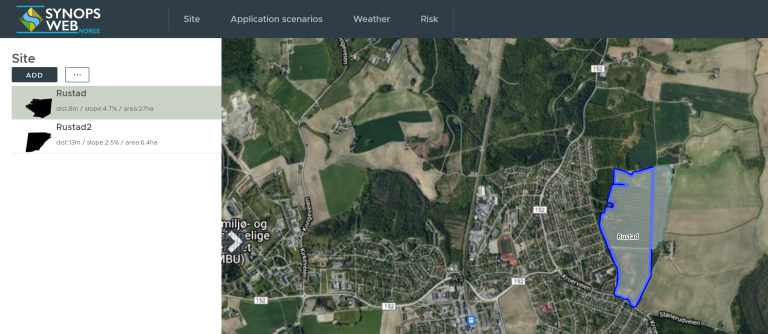
SYNOPS-WEB Norway
Synops WEB Norway is a map-based modelling tool for performing site-appropriate risk assessment of a planned or implemented plant protection strategy. The user selects the area and pesticide use to be considered. Data from digital soil maps, agricultural meteorological services and the Norwegian Food Safety Authority's pesticide database are used in the calculations. This model is field-based, which means that it gives results for the one actual field (selected field marked in blue in Figure 9) and not a larger area. See the link to the left for more info on Synops Web Norway.
Links
PERSAMPersistence and accumulation in soil
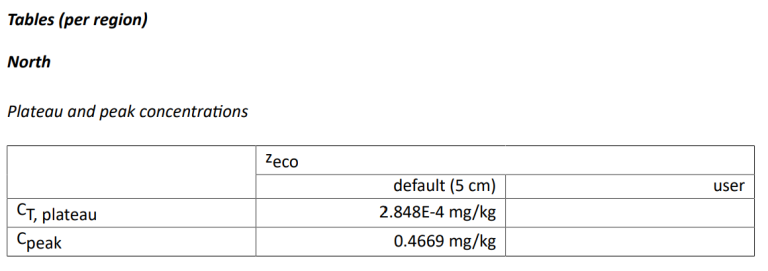
PERSAM
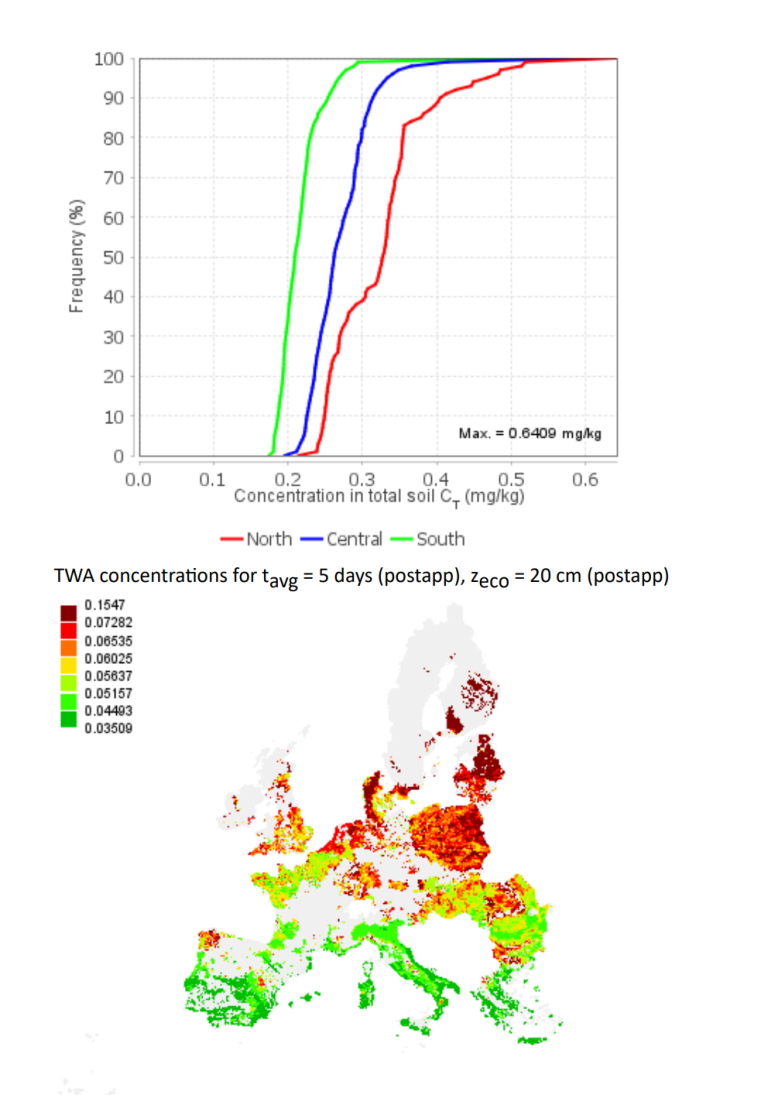
The PERSAM model (Persistence in Soil Analytical Model) is used to assess the fate of pesticides in soil, and predict the concentration of a pesticide in soil and soil water at different soil depths, both immediately after spraying and at different time points after application. In addition, a plateau concentration can be estimated so that the probability of accumulation can be assessed when using the substance over time. Different scenarios have been developed to cover the three regulatory zones in the EU.
Contacts
Roger Holten
Research Scientist
-
Division of Biotechnology and Plant Health
(+47) 915 92 762 roger.holten@nibio.no Office Location: Ås H7
Publications
Abstract
No abstract has been registered