Different calculation methods can lead to major variations in food self-sufficiency rates
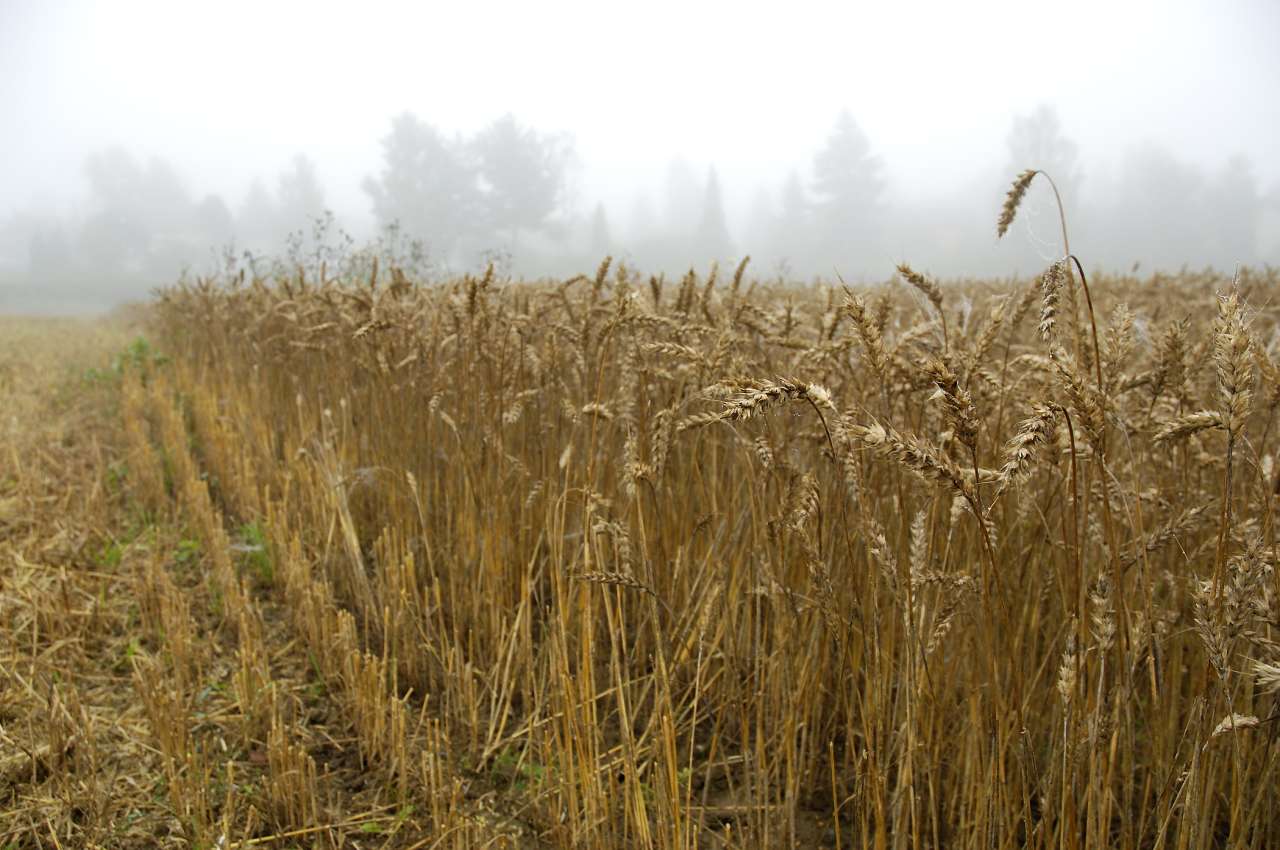
Food-grade wheat is highly important for the level of food self-sufficiency and can only be cultivated in certain parts of Norway. Production varies considerably and is always dependent on weather conditions. Photo: Erling Fløistad / NIBIO
Norway produces only 35–40 per cent of the food we eat, while neighbouring countries like Finland and Germany often report 70–80 per cent. But are we really that much worse off? A new report shows that the answer lies in how the figures are calculated.
With rising geopolitical tensions, climate change, and crises around the world, food self-sufficiency and security are becoming increasingly important.
Norway's food self-sufficiency rate has remained stable at 35–40 per cent over recent decades. Through increased production of Norwegian food products and better use of our resources, the government aims to raise the food self-sufficiency rate (adjusted for imported feed) to 50 per cent by 2030.
In a new report from NIBIO and RURALIS, researchers reveal significant differences in how various countries calculate this self-sufficiency rate.
Self-sufficiency vs coverage rate – what's the difference?
In Norway, we measure the self-sufficiency rate based on the share of food we actually eat, converted to energy. The formula includes national production plus imports minus exports. This covers only food for humans, not animal feed or seed.
The FAO (UN's Food and Agriculture Organisation) calculates what we in Norway call the coverage rate. This indicates how much a country could theoretically produce to meet its energy needs. Unlike the self-sufficiency rate, it does not account for exports. If we used the FAO method, Norway's coverage rate would be higher, thanks to our extensive fish production.
«The units and methods for measuring are of great importance for the result,» explains Simen Wilsher Lohre, senior adviser at NIBIO, who led the work on the report.
Up to 17 per cent difference
The different calculation methods used in Norway and by the FAO result in figures up to 17 per cent lower for Norway's self-sufficiency rate.
«The Norwegian method is tailored to Norwegian conditions and requires detailed data that clearly distinguishes whether production is for food, feed, seed, and so on. Statistics available in many other countries do not make these distinctions,» says Lohre.
The USA and Russia stand out with high self-sufficiency rates for most food items, regardless of the method. Smaller countries like Denmark and Iceland have lower rates. Norway is in the middle tier.
Finland, with a self-sufficiency rate of 58 per cent, appears particularly well-prepared for food supply crises. The country has a goal of high self-sufficiency in emergencies and maintains long-term grain stores equivalent to nine months' consumption.
«The more self-sufficient we are, the safer we are,» emphasises Lohre.
FAO figures also show geographical differences in consumption patterns: nearby countries have fairly similar consumption but greater variation in production structures.
Strongest in meat, dairy, and seafood
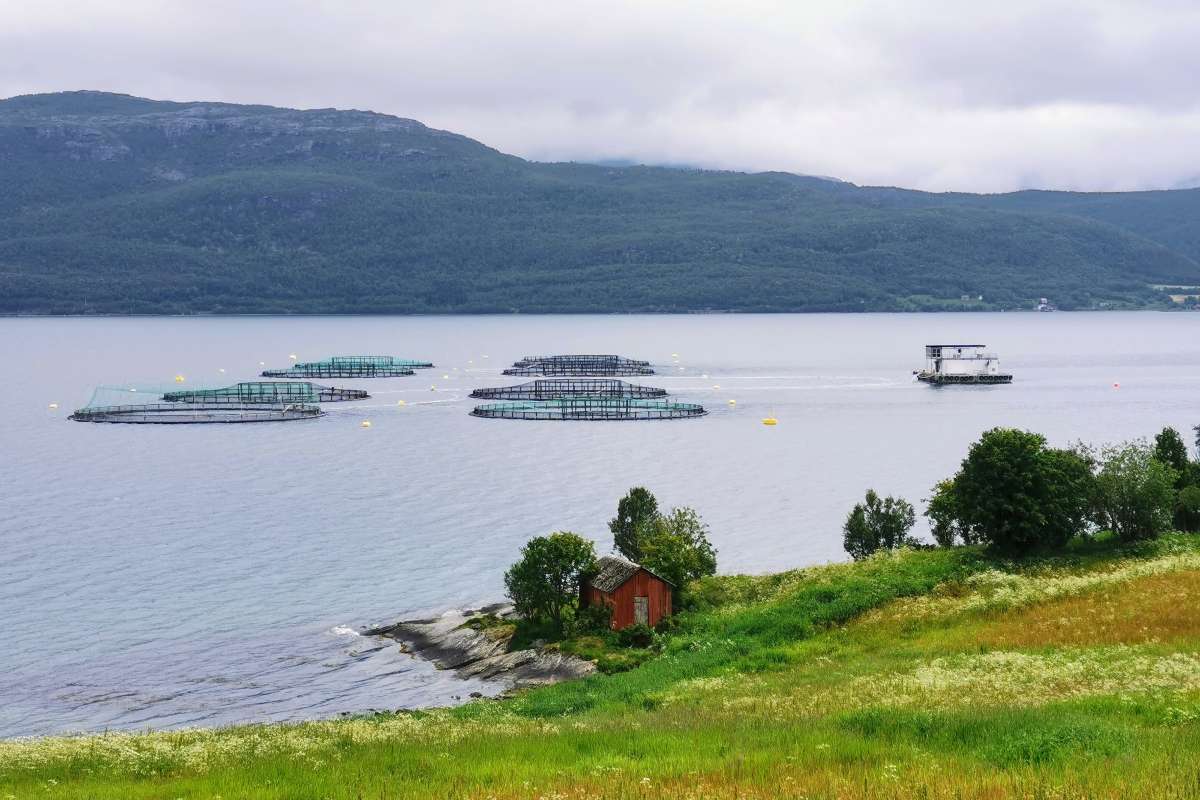
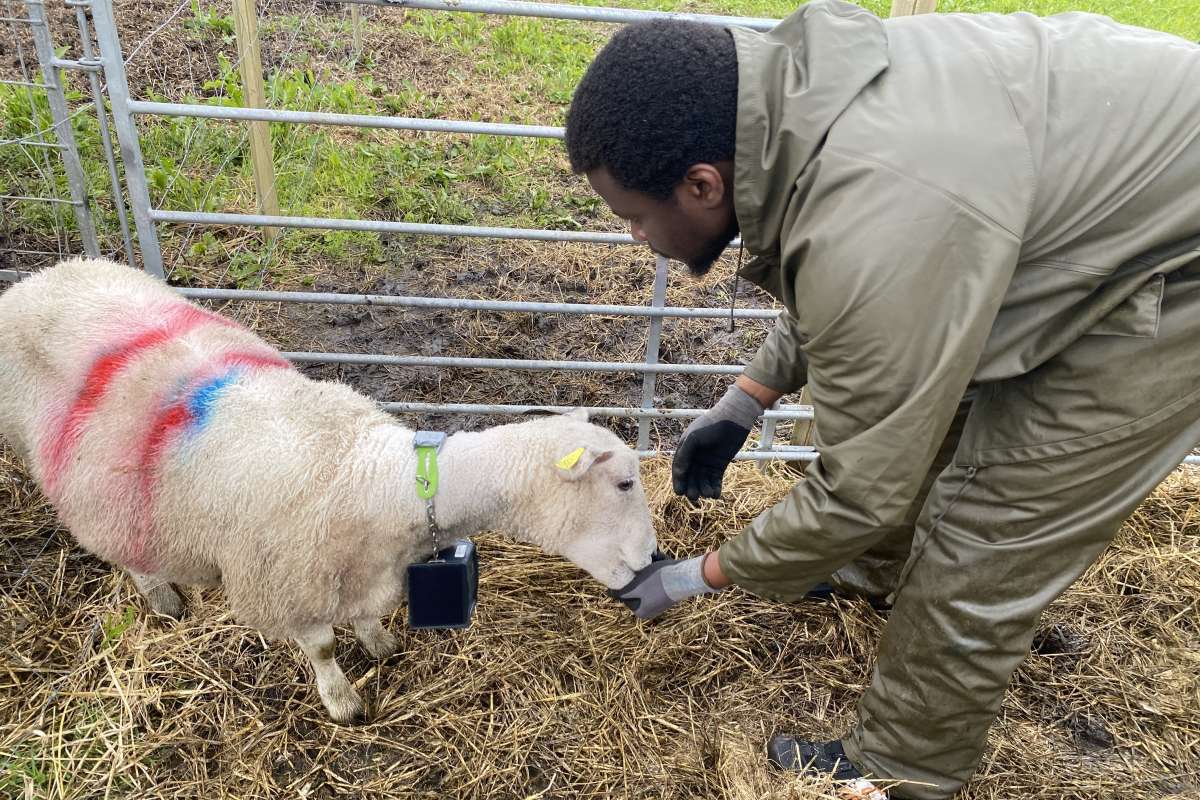
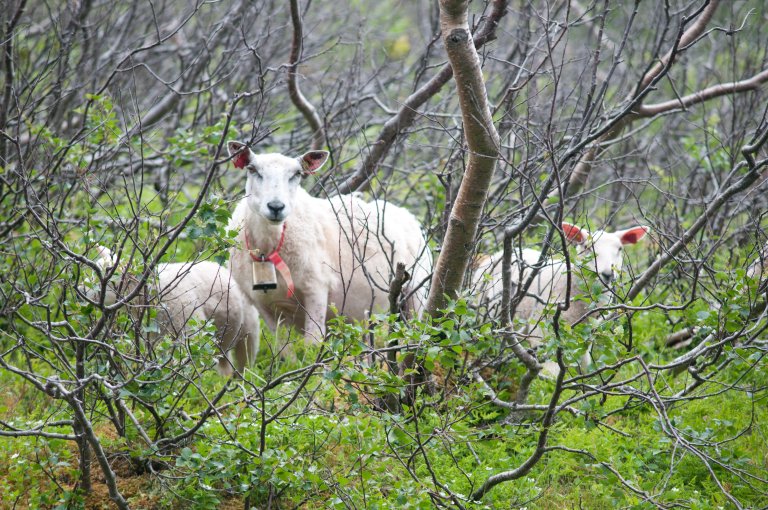
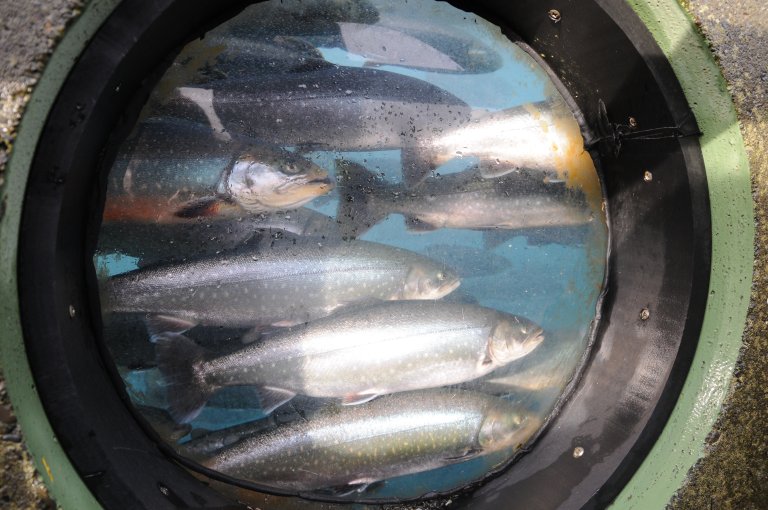
Norway's self-sufficiency rate is highest for animal products and dairy. Much of this comes from roughage- and pasture-based livestock farming with sheep and cattle. We are also strong in seafood, thanks to our expertise in fish farming.
«However, fish farming largely relies on imported feed and thus has little impact on the self-sufficiency calculation. It also makes up a small part of our actual consumption. We must calculate what we actually eat today,» says Lohre.
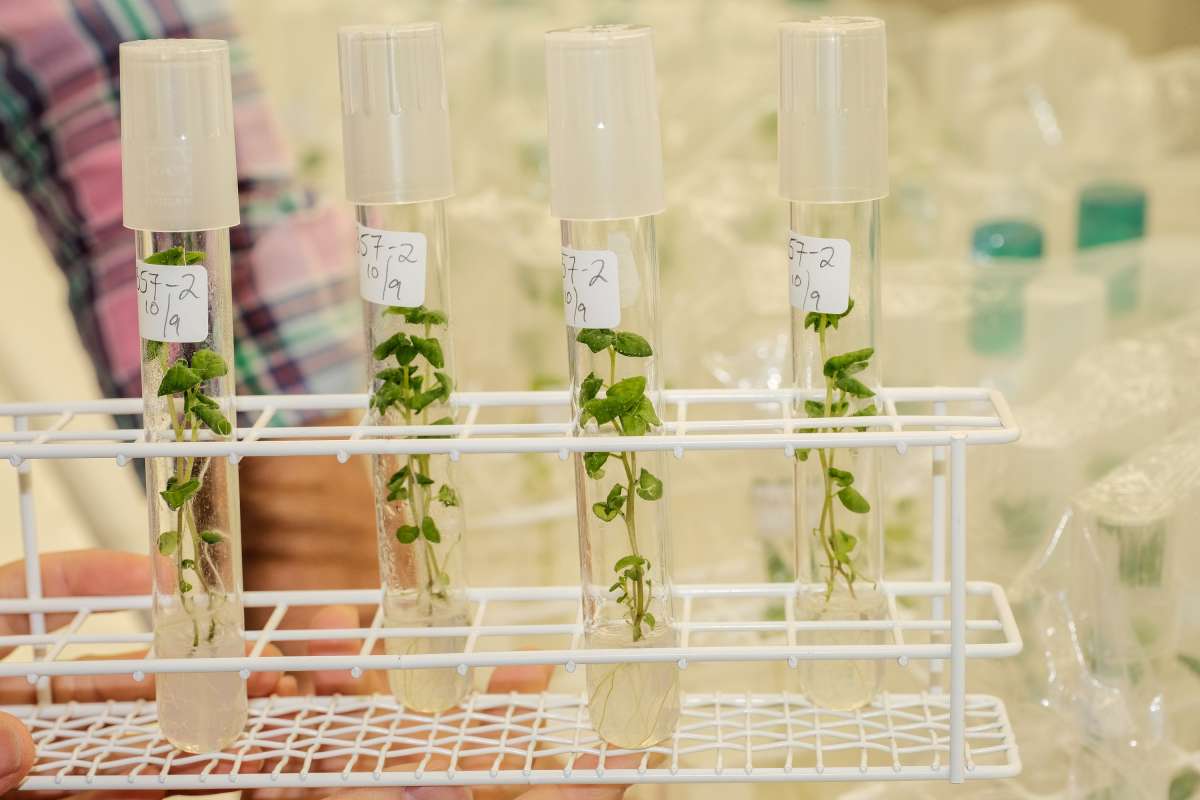
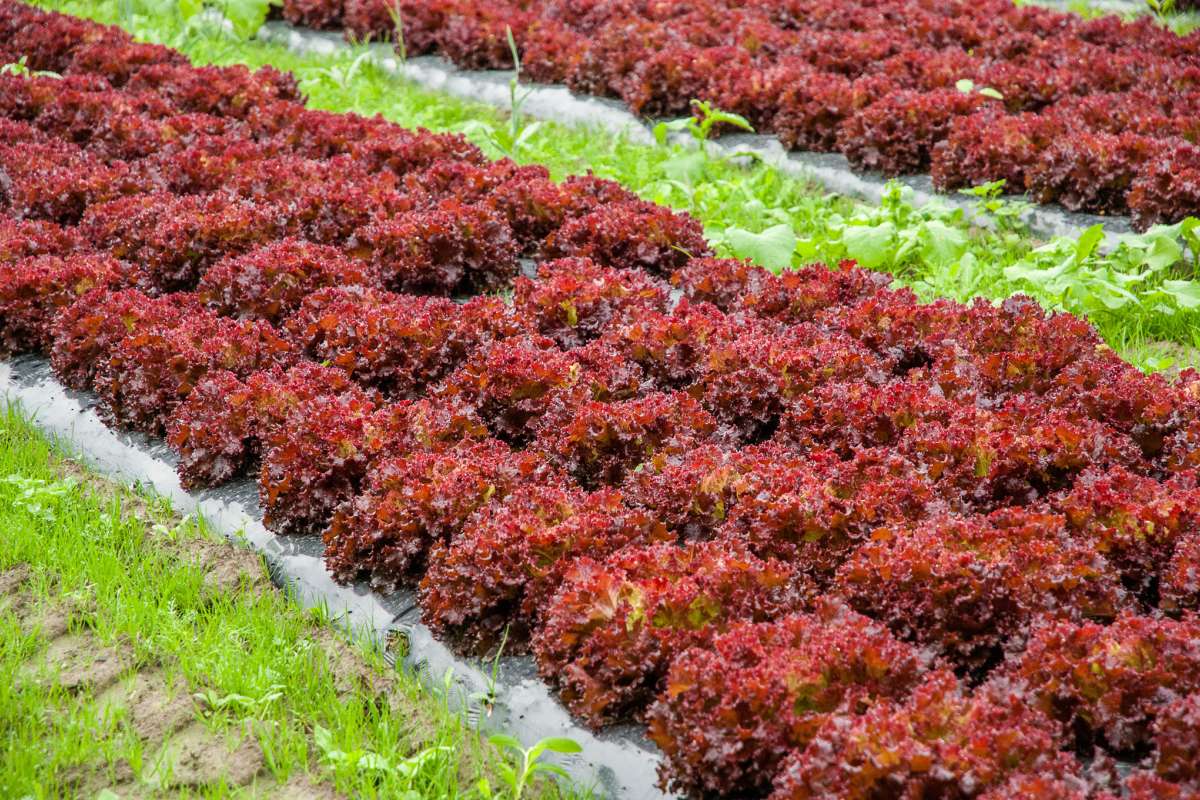
«Norway is weaker in grain production and horticulture, where self-sufficiency is significantly lower. Grain production is heavily dependent on weather conditions, and food grain volumes vary dramatically from year to year. In 2023, only 56.4 million kilos of wheat suitable for food was produced, compared to 274.1 million kilos the previous year. This greatly affects the overall self-sufficiency rate, as grain is a large part of our diet,» concludes Lohre.
The report shows that Norwegian figures are precise and tailored to our context – but comparisons with other countries require consistent calculation methods.
Contacts

Simen Wilsher-Lohre
Senior Adviser
-
Division of Survey and Statistics
(+47) 900 80 456 simen.wilsher-lohre@nibio.no Office Location: Ås O43
Food self-sufficiency rate
Food self-sufficiency rate refers to how much of the food we eat we produce ourselves. Without adjusting for imported feed, our food self-sufficiency rate is 40–45 per cent. When corrected for imported feed, it is 30–35 per cent. The government aims to increase the feed-adjusted food self-sufficiency rate to 50 per cent.
Contacts
Simen Wilsher-Lohre
Senior Adviser
-
Division of Survey and Statistics
(+47) 900 80 456 simen.wilsher-lohre@nibio.no Office Location: Ås O43
Publications
Abstract
I dette prosjektet sammenliknes norsk selvforsyningsgrad med selvforsyningsgraden i andre land. Norsk beregningsmetode brukes, så langt det er mulig, med utgangspunkt i tilgjengelig internasjonal statistikk. Den norske metoden er tilpasset norske forhold, og man vil derfor ikke finne identiske beregninger av selvforsyningsgrad i andre land. Det er gjort forsøk med tilpasninger av metode og datagrunnlag for å imøtekomme behovet for en sammenlikning av selvforsyningsgrad på tvers av land basert på en ensartet metode. Det er gjennomført en analyse av nasjonale beregningsmetoder i Sveits, Tyskland og Østerrike som sammenliknes med den norske metoden. Basert på tilgjengelig internasjonal statistikk fra FAO er selvforsyningsgraden analysert med norsk metode for EU samlet, Sverige, Danmark, Finland, Island, Russland, Sveits, Tyskland, USA, Japan og Sør-Korea.